Measure Overview
Use in CMS Programs
- Finalized for inclusion in the Inpatient Rehabilitation Facility Quality Reporting program in 2012.
- Implemented in the Inpatient Rehabilitation Facility Quality Reporting program in 2014.
- Also active in the Long-Term Care (LTC) Hospital Quality Reporting program and the PPS-Exempt Cancer Hospital Quality Reporting (PCHQR) Program.
Description
Annual risk-adjusted standardized infection ratio (SIR) of catheter-associated urinary tract infections (CAUTI) among adults and children hospitalized as inpatients at acute care hospitals, critical access hospitals, oncology hospitals, long-term acute care hospitals, and acute care rehabilitation hospitals. SIR is reported annually and is calculated by dividing the number of observed CAUTIs by the number of predicted CAUTIs.
Measure Specification
Number of annually observed catheter-associated urinary tract infections (CAUTI) in hospital inpatients.
N/A
N/A
The denominator for both the SIR and the ARM is the total number of predicted CAUTI during hospitalization for patients within the unit of study (i.e., location under surveillance). The predicted number of infections for a facility is calculated based on the reported number of catheter days at the location-level using a negative binomial regression that accounts for the following risk factors:
ACHs: CDC-defined location within a facility (e.g., critical ICUs, SCAs, step-down units, etc.), bed size, medical school affiliation, and facility type
CAHs: medical school affiliation
IRFs: setting type, proportion of admissions with traumatic and non-traumatic spinal cord dysfunction, proportion of admissions with stroke
LTACHs: average length of stay, setting type, and location type.
The following are not considered indwelling catheters by NHSN definitions:
- Suprapubic catheters
- Condom catheters
- “In and out” catheterizations
- Nephrostomy tubes
- Ileoconduits
N/A
Measure Information
Endorsement History
Endorsement History:
- Initial endorsement, 2012.
- New measure endorsed with conditions Spring 2025.
Link to Endorsement Measure Record: National Healthcare Safety Network (NHSN) Catheter-Associated Urinary Tract Infection (CAUTI) Outcome Measure
Measure Performance in Program
Measure Score by Performance Year
Impact Summary: This measure supports the Inpatient Rehabilitation Facility Quality Reporting Program by assessing health care-associated catheter-associated urinary tract infections (CAUTI) among patients in bedded inpatient rehabilitation facilities, an outcome directly associated with patient safety and quality of care.
Based on the most recent data, the total estimated number of CAUTIs across all deciles is approximately 1,400. If inpatient rehabilitation facilities with higher CAUTI rates improved their performance to levels observed among better-performing facilities, the analysis suggests that up to about 1,400 CAUTIs could potentially be avoided, indicating a substantial opportunity for improved patient outcomes.
For this measure, Battelle reviewed the following publicly available datasets available at Inpatient Rehabilitation Facility - Provider Data | Provider Data Catalog (cms.gov):
- Inpatient_rehabilitation_facilities_03_2026.zip (which contains data from April 2024-March 2025 and is referred to as year 2024 in this assessment)
- Inpatient_rehabilitation_facilities_03_2025.zip (which contains data from April 2023-March 2024 and is referred to as year 2023 in this assessment)
- Inpatient_rehabilitation_facilities_03_2024.zip (which contains data from April 2022-March 2023 and is referred to as year 2022 in this assessment)
- Inpatient_rehabilitation_facilities_03_2023.zip (which contains data from April 2021-March 2022 and is referred to as year 2021 in this assessment)
Battelle analyzed all values for “I_006_01” not marked as “Not Available” from the corresponding Inpatient_Rehabilitation_Facility-Provider_Data.csv file.
About Figure 1: Figure 1 is a boxplot that shows how scores have changed based on the most recent 4 years of data available. For each year, the boxplot displays a box with lines and dots to help visualize the range and distribution of scores. The dots represent the points where the lowest 5% and highest 5% of scores fall, and the line connecting them shows where 90% of the scores are located. The box itself covers the middle half of the scores, from the 25th to the 75th percentile. Inside the box, a horizontal line marks the median score, which is the middle value, while a “+” sign shows the average score. This type of graph makes overall trends in scores over time as well as the consistency and spread of the results easier to understand.
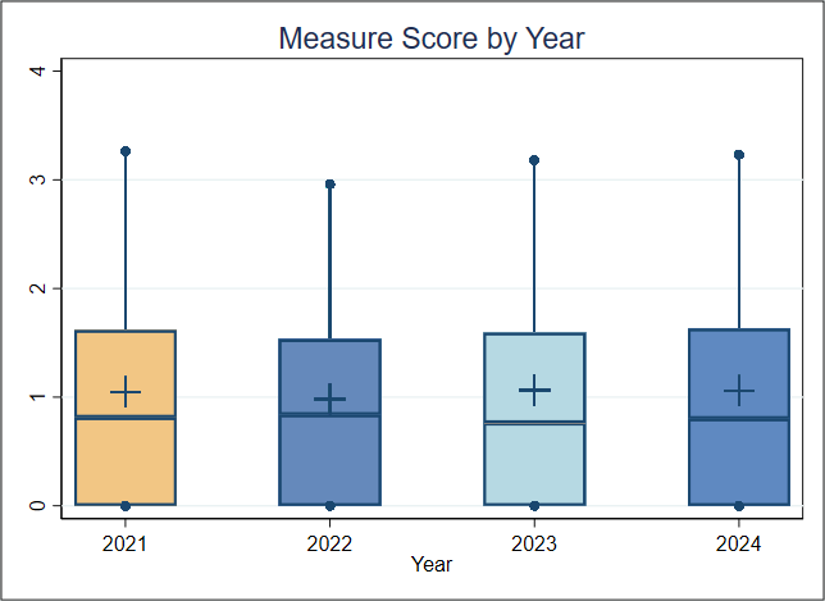
Figure 1. Boxplot of Measure Score by Year
Figure 1 Interpretation: There is no discernible change across the 4 years. For this measure, a lower score indicates better quality of care.
Score Distribution for Most Recent Years
About Table 1: Table 1 illustrates the distribution of scores and the number of patients represented within each group. It is important to note that the groups (referred to as deciles, each comprising 10% of the organizations) with the lowest or highest scores may contain more or fewer patients than other groups. For example, if the lowest-scoring decile includes only 5% of the total patient population, this smaller group size may be associated with lower performance scores.
Table 1. Importance in the Most Recent Year of Data Available (Decile by Measure Score, FY2024)
| Overall | Decile 1 | Decile 2 | Decile 3 | Decile 4 | Decile 5 | Decile 6 | Decile 7 | Decile 8 | Decile 9 | Decile 10 | |
| Average SIR (Standard Deviation) | 1.060 (1.089) | 0 | 0 | 0 | 0 | 0.117 | 0.688 | 1.142 | 1.706 | 2.326 | 3.562 |
| Average Raw Rate (Standard Deviation) | 0.200 (0.328) | 0 | 0 | 0 | 0 | 0.006 | 0.099 | 0.194 | 0.291 | 0.450 | 0.957 |
| Entities | 1,123 | 113 | 112 | 112 | 113 | 112 | 112 | 113 | 112 | 112 | 112 |
| Patients | 790,630 | 50,594 | 48,918 | 58,134 | 49,690 | 77,282 | 167,930 | 116,230 | 100,352 | 82,073 | 39,427 |
Table 1 Interpretation: To estimate the number of negative outcomes (CAUTIs), the number of patients is multiplied by the average raw rate for each decile. Right now, the total estimated number of negative outcomes across all deciles is about 1,400. If the average performance of Decile 3 (0%) is considered a plausible, achievable score, and the entities in Deciles 4 through 10 improved to reach that score, about 1,400 fewer measured patients would contract CAUTIs. This translates to about one patient per entity.
Meaningfulness
Importance
The Meaningfulness criterion will be evaluated as part of the full Preliminary Assessment available in September.
Data Stream Burden Reduction
Data Stream Burden Reduction
This criterion will be evaluated as part of the full Preliminary Assessment available in September.
Alignment with the Patient Health Care Journey
Alignment with the Patient Health Care Journey
This criterion will be evaluated as part of the full Preliminary Assessment available in September.
Public Comment
Enter a comment below