
Measure Overview
Use in CMS Programs
- Finalized for inclusion in Skilled Nursing Facility Quality Reporting in 2021.
- Implemented in Skilled Nursing Facility Quality Reporting in 2022.
- This measure also has active program-variants in Skilled Nursing Facility Value-Based Purchasing.
Description
The Skilled Nursing Facility Healthcare-Associated Infections Requiring Hospitalization measure estimates the risk-standardized rate of HAIs that are acquired during SNF care and result in hospitalization. SNF HAIs that are acquired during SNF care and result in hospitalization are identified using the principal diagnosis on the Medicare inpatient (IP) claims of SNF residents. The hospitalization must occur during the period beginning on day four after SNF admission and within three days after SNF discharge or the end of active SNF care. The measure is risk-adjusted to allow for comparison based on residents with similar characteristics across SNFs. Since HAIs are not considered never-events, the measure's objective is to identify SNFs that have higher HAI rates than their peers.
Measure Specification
To calculate the measure numerator, first count the outcome and then apply risk adjustment. The final measure numerator is the adjusted numerator.
N/A
N/A
The study population is Medicare Part A FFS SNF stays that ended during the measure time period. To calculate the measure denominator, the number of eligible SNF stays are counted, then risk adjustment is applied. The final measure denominator is the adjusted denominator.
The eligible stays for this measure are all Medicare FFS SNF stays that do not meet the exclusion criteria during the measurement period. Residents who died during the SNF stay or during the post-discharge window (three days after SNF discharge or the end of active SNF care) and residents with an ongoing SNF stay by the end of the measure period are included in the denominator. SNF stays are excluded from the denominator if they meet one or more of the following criteria:
- Resident is less than 18 years old at time of SNF admission.
- The SNF length of stay was shorter than four days.
- Residents who were not continuously enrolled in Part A FFS Medicare during the SNF stay, 12 months prior to the measure period, and three days after the end of SNF stay.
- Residents who did not have Part A short-term acute care hospital stay within 30 days prior to the SNF admission date. The short-term stay must have positive payment and positive length of stay.
- Residents who were transferred to a federal hospital from the SNF as determined by the status code on the SNF claim.
- Residents who received care from a provider located outside of the United States, Puerto Rico, or a U.S. territory as determined from the first two characters of the SNF CMS Certification Number.
- SNF stays in which data were missing on any variable used in the measure construction or risk adjustment. This also includes stays where Medicare did not pay for the stay, which is identified by non-positive payment on the SNF claim.
- SNF stays from swing beds in critical access hospitals.
N/A
Measure Information
Endorsement History
Endorsement History:
- Endorsed (Patient Safety Spring Cycle), 2023
Link to Endorsement Measure Record: Skilled Nursing Facility Healthcare-Associated Infections Requiring Hospitalization (SNF HAI)
Measure Performance in Program
Measure Score by Performance Year
Impact Summary: This measure supports the Skilled Nursing Facility (SNF) Quality Reporting Program’s goal of improving care outcomes by identifying skilled nursing facilities with higher risk‑standardized rates of health care‑associated infections that occur during SNF care and lead to hospitalization. The measure enables comparison across facilities and targets opportunities to reduce infections that worsen patient outcomes.
Figure 1 shows the distribution of performance rates over time with medians used to discuss distribution changes over time. The median risk-standardized performance rate for this measure decreased from 7.4% in 2021 to 6.8% in 2022, indicating an improvement in scores among reporting SNFs. From 2022-2024, the rate increased slightly (by only about 0.1% annually). Overall, there is minimal variation for this measure over the years examined.
Table 1 examines average scores from 2024 by decile. The total estimated number of negative outcomes across all deciles is about 83,000. If the average performance of Decile 3 (6.39%) is considered a plausible, achievable score, and the entities in Deciles 4 through 10 improved to reach that score, about 11,500 fewer patients would contract HAIs requiring hospitalization.
For this measure, the Battelle team reviewed the following publicly available datasets available at Skilled Nursing Facility Quality Reporting Program - Provider Data | Provider Data Catalog:
- nursing_homes_including_rehab_services_03_2026.zip (which contains data from October 2023-September 2024 and is referred to as year 2024 in this assessment)
- nursing_homes_including_rehab_services_03_2025.zip (which contains data from October 2022-September 2023 and is referred to as year 2023 in this assessment)
- nursing_homes_including_rehab_services_03_2024.zip (which contains data from October 2021-September 2022 and is referred to as year 2022 in this assessment)
- nursing_homes_including_rehab_services_03_2023.zip (which contains data from October 2020-September 2021 and is referred to as year 2021 in this assessment)
The Battelle team analyzed all values for “Measure Code of S_039_01_HAI_NUMBER, S_039_01_HAI_VOLUME, and S_039_01_HAI_RS_RATE not marked as “Not Available” from the corresponding Skilled_Nursing_Facility_Quality_Reporting_Program_Provider_Data.csv and Swing_Bed_SNF_data.csv files.
About Figure 1: Figure 1 is a boxplot that shows how scores have changed based on the most recent 4 years of data available. For each year, the boxplot displays a box with lines and dots to help visualize the range and distribution of scores. The dots represent the points where the lowest 5% and highest 5% of scores fall, and the line connecting them shows where 90% of the scores are located. The box itself covers the middle half of the scores, from the 25th to the 75th percentile. Inside the box, a horizontal line marks the median score, which is the middle value, while a “+” sign shows the average score. This type of graph makes overall trends in scores over time as well as the consistency and spread of the results easier to understand.
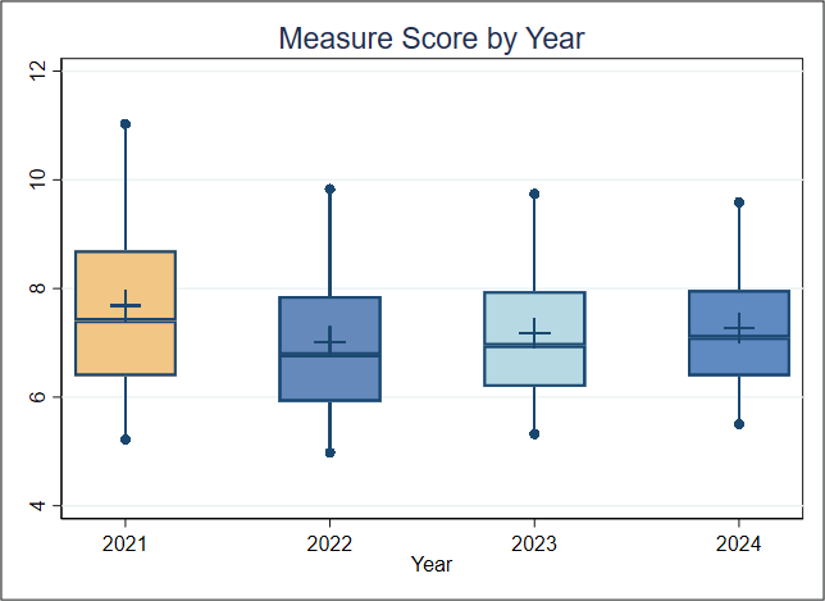
Figure 1. Boxplot of Measure Score by Year
Figure 1 Interpretation: Although the median risk-standardized rate decreased from 7.4% in 2021 to 6.8% in 2022, the rate has increased by only 0.1% per year since 2022. For this measure, a lower score indicates better quality of care.
Score Distribution for Most Recent Years
About Table 1: Table 1 illustrates the distribution of scores and the number of patients represented within each group for the most recent year with data available. It is important to note that the groups (referred to as deciles, each comprising 10% of the facilities) with the lowest or highest scores may contain more or fewer patients than other groups. For example, if the lowest-scoring decile includes only 5% of the total patient population, then smaller group size may be associated with lower performance scores. The overall average is the average score across the 11,100 facilities.
Table 1. Importance in the Most Recent Year of Data Available (Decile by Measure Score, 2024)
| Overall | Decile 1 | Decile 2 | Decile 3 | Decile 4 | Decile 5 | Decile 6 | Decile 7 | Decile 8 | Decile 9 | Decile 10 | |
| Average Score (Standard Deviation) | 7.27 (1.27) | 5.39 | 6.06 | 6.39 | 6.69 | 6.96 | 7.24 | 7.57 | 7.98 | 8.55 | 9.85 |
| Facilities | 11,100 | 1,100 | 1,100 | 1,100 | 1,100 | 1,100 | 1,100 | 1,100 | 1,100 | 1,100 | 1,100 |
| Patients | 1,155,852 | 185,368 | 115,035 | 102,500 | 98,052 | 102,175 | 99,658 | 107,247 | 105,502 | 113,688 | 126,627 |
Table 1 Interpretation: To estimate the number of negative outcomes (HAIs requiring hospitalization), the number of patients is multiplied by the average score for each decile. In 2024, the total estimated number of negative outcomes across all deciles is about 83,000. If the average performance of Decile 3 (6.39%) is considered a plausible, achievable score, and the entities in Deciles 4 through 10 improved to reach that score, about 11,500 fewer patients would contract HAIs requiring hospitalization.
Meaningfulness
Importance
The Meaningfulness criterion will be evaluated as part of the full Preliminary Assessment available in September.
Data Stream Burden Reduction
Data Stream Burden Reduction
This criterion will be evaluated as part of the full Preliminary Assessment available in September.
Alignment with the Patient Health Care Journey
Alignment with the Patient Health Care Journey
This criterion will be evaluated as part of the full Preliminary Assessment available in September.