Measure Overview
Use in CMS Programs
- Measure finalized in rulemaking for use in Hospital Outpatient Quality Reporting Program in the CY 2015 OPPS/ASC final rule.
- Measure has been active in the Hospital Outpatient Quality Reporting Program since 2016.
Description
The facility-level, post-surgical risk-standardized hospital visit ratio (RSHVR) of the predicted to expected number of all-cause, unplanned hospital visits within 7 days of a same-day surgery at a hospital outpatient department among Medicare Fee-for-Service (FFS) patients aged 65 years and older.
Measure Specification
The surgery measure outcome is all-cause unplanned hospital visits, defined as 1) an inpatient admission directly following surgery or 2) an emergency department (ED) visit, observation stay, or unplanned inpatient admission occurring after discharge from the HOPD and within 7 days of the outpatient surgery.
N/A
N/A
Eligible same-day surgeries or cystoscopy procedures with intervention performed at HOPDs for Medicare FFS patients aged 65 years and older, with the exception of eye surgeries and same-day surgeries performed concurrently with high-risk procedures.
The measure excludes:
- Procedures for patients who lack continuous enrollment in Medicare FFS Parts A and B in the 7 days after the surgery.
- Surgeries that occur on the same day and at the same hospital as an ED visit that is billed on a different claim than the index surgery, unless the ED visit has a diagnosis indicative of a complication of care.
- Surgeries that are billed on the same hospital claim as an ED visit and that occur on the same calendar day unless the ED visit has a diagnosis indicative of a complication of care.
- Surgeries that are billed on the same hospital outpatient claim and that occur after the ED visit.
- Surgeries that are billed on the same outpatient claim as an observation stay.
N/A
Measure Information
Endorsement History
- Initially endorsed in 2015.
- Maintenance review retained endorsement in 2023.
Link to Endorsement Measure Record: Hospital Visits after Hospital Outpatient Surgery
Measure Performance in Program
Measure Score by Performance Year
Impact Summary: This measure supports the Hospital Outpatient Quality Reporting Program’s goal of improving outpatient care quality and patient experience in hospital settings by monitoring the post-surgical risk-standardized hospital visit ratio within 7 days of a same-day surgery at a hospital outpatient department.
Performance varied from 2020 to 2024, with the widest range of measure scores for hospital outpatient departments (HOPDs) occurring in 2023. As shown in Table 1, the highest-performing 10% of the entities (Decile 1) contains 21% of the total patients, indicating that larger entities tend to perform better.
For this measure, Battelle reviewed the following publicly available datasets available at Hospitals data archive | Provider Data Catalog:
- hospitals_02_2026.zip (which contains data from 2024)
- hospitals_11_2025.zip (which contains data from 2023)
- hospitals_10_2024.zip (which contains data from 2022)
- hospitals_11_2023.zip (which contains data from 2021)
- hospitals_10_2022.zip (which contains data from 2020)
Battelle analyzed all values for “Measure_ID”=”OP_36” not marked as “Not Available” from the corresponding Unplanned_Hospital_Visits-Hospital.csv file.
About Figure 1: Figure 1 is a boxplot that shows how scores have changed based on the most recent 5 years of data available. For each year, the boxplot displays a box with lines and dots to help visualize the range and distribution of scores. The dots represent the points where the lowest 5% and highest 5% of scores fall, and the line connecting them shows where 90% of the scores are located. The box itself covers the middle half of the scores, from the 25th to the 75th percentile. Inside the box, a horizontal line marks the median score, which is the middle value, while a “+” sign shows the average score. This type of graph makes overall trends in scores over time as well as the consistency and spread of the results easier to understand.
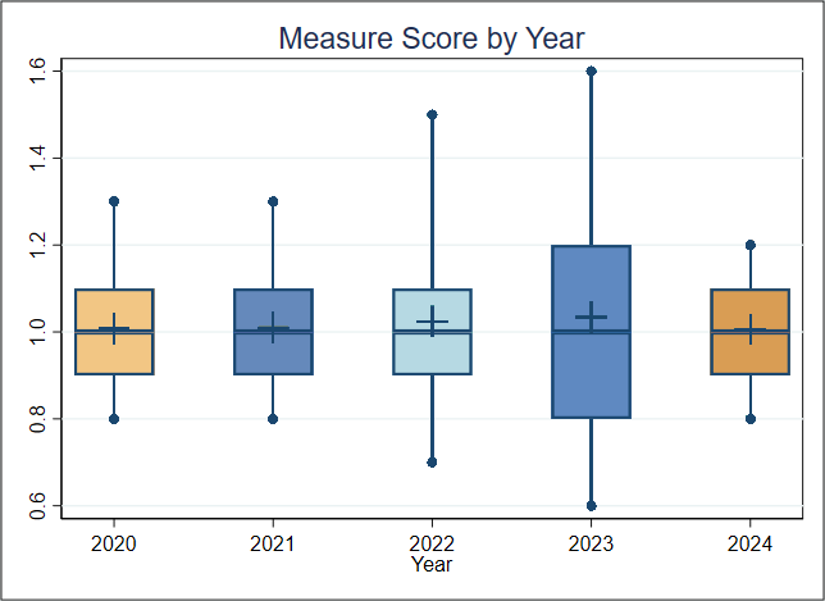
Figure 1. Boxplot of Measure Score by Year
Figure 1 Interpretation: Because this measure is a ratio of an entity’s risk-adjusted rate to the national rate for the same year, Figure 1 is not very informative for assessing change over time. The median ratio is always 1.0. Slight variation in spread year-over-year suggests gap between best and worst performers shifted modestly over time, but no clear trend can be drawn from this alone. For this measure, a lower score indicates better quality of care.
Score Distribution for Most Recent Years
About Table 1: Table 1 illustrates the distribution of scores and the population represented within each group, for the most recent year with data available. It is important to note that the groups (referred to as deciles, each comprising 10% of the organizations) with the lowest or highest scores may contain larger or smaller populations than other groups. For example, if the lowest-scoring decile includes only 5% of the total population, then smaller group size may be associated with lower performance scores.
Table 1. Importance in the most recent year of data available (Decile by Measure Score, 2024)
| Overall | Decile 1 | Decile 2 | Decile 3 | Decile 4 | Decile 5 | Decile 6 | Decile 7 | Decile 8 | Decile 9 | Decile 10 | |
| Average Score (Standard Deviation) | 1.010 (0.128) | 0.801 | 0.900 | 0.900 | 0.978 | 1.000 | 1.000 | 1.013 | 1.100 | 1.114 | 1.252 |
| Entities | 2,725 | 273 | 272 | 273 | 272 | 273 | 272 | 273 | 272 | 273 | 272 |
| Population | 1,228,348 | 259,203 | 137,172 | 138,342 | 96,259 | 89,338 | 93,799 | 103,467 | 108,595 | 94,959 | 107,214 |
Table 1 Interpretation: The highest-performing 10% of the entities (Decile 1) contains 259,203 patients, 21% of the 1,228,348 total patients, indicating that larger entities tend to perform better. Based on the information available in the datasets utilized, Battelle could not calculate an estimate of what plausible improvement on this measure might look like across entities. Additional analyses beyond the scope of this impact assessment may be warranted to directly evaluate the association between population size and measure score and to identify the institutional factors that contribute to stronger performance on this measure.
Meaningfulness
Importance
The Meaningfulness criterion will be evaluated as part of the full Preliminary Assessment available in September.
Data Stream Burden Reduction
Data Stream Burden Reduction
This criterion will be evaluated as part of the full Preliminary Assessment available in September.
Alignment with the Patient Health Care Journey
Alignment with the Patient Health Care Journey
This criterion will be evaluated as part of the full Preliminary Assessment available in September.
Public Comment
Enter a comment below
Comments