Breadcrumb

  1. Home

Not Endorsed

Adult Community-Onset (CO) Sepsis Standardized Mortality Ratio (SMR)

Annual risk-adjusted standardized mortality ratio (SMR) of adult inpatients with community-onset sepsis who died during their hospitalization or were discharged to hospice. SMR is reported annually and is calculated by dividing the number of observed community-onset sepsis deaths by the number of predicted community-onset sepsis deaths. 

Adult Primary Rhegmatogenous Retinal Detachment Surgery: No Return to the Operating Room Within 90 Days of Surgery

CMS Measures Inventory Tool (CMIT) ID
00031-01-C-MIPS
Steward Organization Group
American Academy of Ophthalmology
Committee
MSR Recommendation Group
    Measure Overview
      Use in CMS Programs
      CMS Program History
      • Finalized through rulemaking for inclusion in the Merit-based Incentive Payment System (MIPS) in 2016. 
      • Implemented in MIPS starting with Performance Year (PY) 2017. 
      Description

      Patients aged 18 years and older who had surgery for primary rhegmatogenous retinal detachment who did not require a return to the operating room within 90 days of surgery.

      Numerator

      Patients who did not return to the operating room within 90 days for complications within the operative eye.

      Numerator Exclusions

      N/A

      Numerator Exceptions

      N/A

      Denominator

      Patients aged 18 years or older who had surgery for primary rhegmatogenous retinal detachment.

      Denominator Exclusions

      Surgical procedures that included the use of silicone oil.

      Denominator Exceptions

      N/A

      Cascade of Meaningful Measures Priority
      Measure Type
      Outcome
      Level of Analysis
      Clinician: Group/Practice
      Clinician: Individual
      Care Setting
      Ambulatory Care: Clinician Office
      CBE Endorsement Status
      Not Endorsed
      CBE Endorsement History

      N/A

        About this Analysis (Measure Score by PY)

        Impact Summary: This measure supports the Merit‑based Incentive Payment System by assessing short‑term surgical outcomes for adults undergoing primary rhegmatogenous retinal detachment surgery, specifically the absence of a return to the operating room within 90 days of the initial procedure. 

        Performance on this measure is consistently high, with most clinicians achieving rates above 90% and a substantial proportion achieving 100%. 

        Based on the most recent benchmark data, if clinicians in Deciles 1 through 7 improved to the average performance observed in Decile 8 (100%), the percentage of patients with no return to the operating room within 90 days of surgery could increase by about 5 percentage points, from 94.7% to nearly 100%, potentially improving patient outcomes.

        For this measure, Battelle reviewed the following publicly available datasets at Benchmarks - QPP:

        • 2026 MIPS Quality Benchmarks.csv (referred to as year 2024 in this assessment)
        • 2025 MIPS Quality Benchmarks.csv (referred to as year 2023 in this assessment)
        • 2024 MIPS Quality Benchmarks.csv (referred to as year 2022 in this assessment)
        • 2023 MIPS Quality Benchmarks.csv (referred to as year 2021 in this assessment)

        Battelle analyzed benchmark values for “Measure_ID”=384.


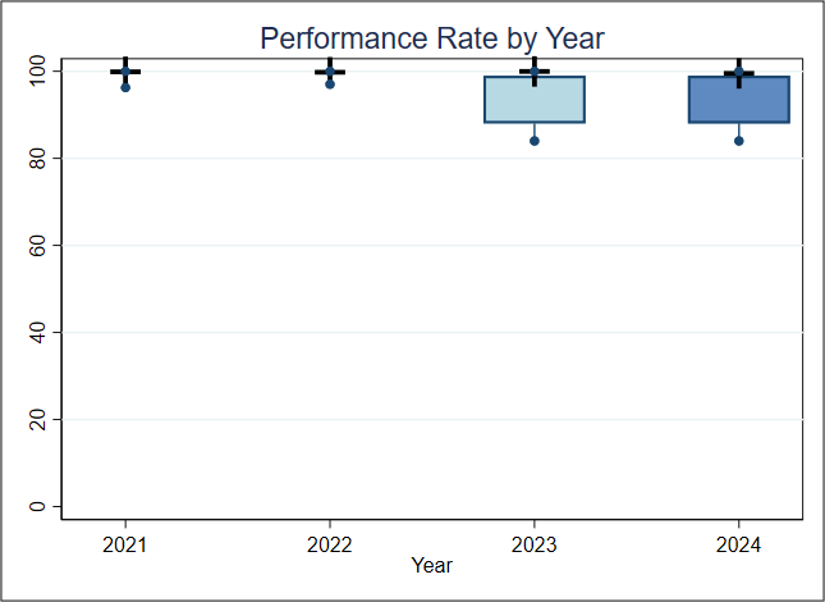
        About Figure 1: Figure 1 is a boxplot that shows how rates have changed based on the most recent 4 years of data available. For each year, the boxplot displays a box with lines and dots to help visualize the range and distribution of rates. The dots represent the minimum and maximum rates, and the line connecting them shows the range of the rates. The box itself covers the middle 60% of the rates, from the 20th to the 80th percentile. A “+” sign shows the average rate. This type of graph makes overall trends in rates over time as well as the consistency and spread of the results easier to visualize.

        Figure 1 (Measure Score by PY)
        boxplot

        Figure 1. Boxplot of Performance Rate by Year

        Interpretation (Measure Score by PY)

        Figure 1 Interpretation: For each of the 4 years, at least 20% of clinicians have a 100% performance rate and, except for 2022, at least 80% of the clinicians have a performance rate greater than 90%. For this measure, a higher performance rate indicates better quality of care. 


        About this Analysis (Score Distro)

        About Table 1: Table 1 illustrates the distribution of rates across deciles in the most recent data available. 

        Table 1 (Score Distro)

        Table 1. Importance (Decile by Performance Rate, FY2024)

         MeanDecile 1Decile 2Decile 3Decile 4Decile 5Decile 6Decile 7Decile 8Decile 9Decile 10
        Rate94.771.4-87.187.1-91.992.0-93.393.3-94.794.7-96.796.7-97.197.1-100100100100
        Interpretation (Score Distro)

        Table 1 Interpretation: Nearly all clinicians have a rate greater than 80%, more than 80% of clinicians have a rate greater than 90%, and more than 30% of the clinicians have a performance rate of 100%. If the average performance of Decile 8 (100%) is considered a plausible, achievable rate, and the clinicians in Deciles 1 through 7 improved to reach that rate, the estimated percentage of patients with no return to the operating room within 90 days of surgery would go up by about 5% (from 94.7% to nearly 100%), potentially leading to better health outcomes for these patients.

          Importance Criterion Definition

          The Meaningfulness criterion will be evaluated as part of the full Preliminary Assessment available in September.  

            Criterion Definition

            This criterion will be evaluated as part of the full Preliminary Assessment available in September.  

              Criterion Definition

              This criterion will be evaluated as part of the full Preliminary Assessment available in September.  

              PA Type
              Performance and Impact Analysis (PIA)

              Advance Care Planning (ACP)

              Percentage of patients aged 18 years and older at the start of the measurement period with one or more inpatient encounters during the measurement period who have an advance care planning document or documentation of an advance care planning discussion resulting in a documented decision in the electronic health record (EHR) by the time of hospital discharge for at least one hospital encounter during the measurement period.  

              Appropriate Assessment of Retrievable Inferior Vena Cava (IVC) Filters for Removal

              CMS Measures Inventory Tool (CMIT) ID
              00068-01-C-MIPS
              Steward Organization Group
              Society of Interventional Radiology
              Committee
              MSR Recommendation Group
                Measure Overview
                  Use in CMS Programs
                  CMS Program History
                  • Finalized through rulemaking for inclusion in the Merit-based Incentive Payment System (MIPS) in 2016. 
                  • Implemented in MIPS starting with Performance Year (PY) 2017.
                  Description

                  Percentage of patients in whom a retrievable IVC filter is placed who, within 3 months post-placement, have a documented assessment for the appropriateness of continued filtration, device removal or the inability to contact the patient with at least two attempts.

                  Numerator

                  Number of patients that have appropriate IVC filter follow-up.

                  Numerator Exclusions

                  N/A

                  Numerator Exceptions

                  N/A

                  Denominator

                  All patients who have a retrievable IVC filter placed with the intent for potential removal at time of placement.

                  Denominator Exclusions

                  None

                  Denominator Exceptions

                  N/A

                  Cascade of Meaningful Measures Priority
                  Measure Type
                  Process
                  Level of Analysis
                  Clinician: Group/Practice
                  Clinician: Individual
                  Care Setting
                  Ambulatory Surgery Center
                  Hospital: Outpatient
                  CBE Endorsement Status
                  Not Endorsed
                  CBE Endorsement History

                  N/A

                    About this Analysis (Measure Score by PY)

                    Impact Summary: This measure supports the Merit‑based Incentive Payment System (MIPS) by promoting appropriate follow‑up assessment for patients who receive retrievable inferior vena cava (IVC) filters, a process intended to support safe device management and timely removal when clinically appropriate. 

                    Due to low reporting on this measure, no benchmark data are currently available in the publicly reported MIPS Quality Benchmarks files reviewed for this assessment. As a result, performance trends and the potential impact of improvement on patient outcomes cannot be evaluated at this time. The absence of benchmark data limits the ability to assess the importance or impact of this measure within MIPS. The measure is included in the Interventional Radiology MIPS Value Pathway (MVP), which may help increase adoption and reporting in the future.

                    For this measure, Battelle reviewed the following publicly available datasets at Benchmarks - QPP:

                    • 2026 MIPS Quality Benchmarks.csv 
                    • 2025 MIPS Quality Benchmarks.csv 
                    • 2024 MIPS Quality Benchmarks.csv 
                    • 2023 MIPS Quality Benchmarks.csv

                    There are no benchmark values for “Measure_ID”=421 in these files, and therefore no data are available to assess this measure. During these years, CMS did not receive sufficient data submissions to establish a performance period benchmark.

                      Importance Criterion Definition

                      The Meaningfulness criterion will be evaluated as part of the full Preliminary Assessment available in September.  

                        Criterion Definition

                        This criterion will be evaluated as part of the full Preliminary Assessment available in September. 

                          Criterion Definition

                          This criterion will be evaluated as part of the full Preliminary Assessment available in September. 

                          Barrett’s Esophagus

                          CMS Measures Inventory Tool (CMIT) ID
                          00087-01-C-MIPS
                          Steward Organization Group
                          College of American Pathologists
                          Committee
                          MSR Recommendation Group
                            Measure Overview
                              Use in CMS Programs
                              CMS Program History
                              • Finalized through rulemaking for inclusion in the Merit-based Incentive Payment System (MIPS) in 2016. 
                              • Implemented in MIPS starting with Performance Year (PY) 2017. 
                              Description

                              Percentage of esophageal biopsy reports that document the presence of Barrett’s mucosa that also include a statement about dysplasia.

                              Numerator

                              Esophageal biopsy report documents the presence of Barrett’s mucosa and includes a statement about dysplasia.

                              Numerator Exclusions

                              N/A

                              Numerator Exceptions

                              N/A

                              Denominator

                              All surgical pathology esophageal biopsy reports for Barrett’s Esophagus.

                              Denominator Exclusions

                              None. 

                              Denominator Exceptions

                              N/A

                              Cascade of Meaningful Measures Priority
                              Measure Type
                              Process
                              Level of Analysis
                              Clinician: Group/Practice
                              Clinician: Individual
                              Care Setting
                              Hospital: Outpatient
                              Laboratory
                              CBE Endorsement Status
                              Not Endorsed
                              CBE Endorsement History

                              N/A

                                About this Analysis (Measure Score by PY)

                                Impact Summary: This measure evaluates documentation quality for esophageal biopsy reports in the Merit‑based Incentive Payment System (MIPS) by assessing whether reports that identify Barrett’s mucosa also include a statement regarding dysplasia. As a process measure, it supports MIPS goals by encouraging complete and standardized pathology reporting, which contributes to accurate diagnosis and informed clinical management. This measure is subject to the 7-point Cap Removal Benchmark and represents one of the few measures applicable for pathologists within the MIPS set. 

                                Performance has been uniformly high since implementation, with benchmark data indicating that in 2021 and 2022 all reporting clinicians achieved rates greater than 95%. In 2023 and 2024, mean performance remained high, while the distribution of performance rates has widened, with a subset of clinicians reporting rates below 90%. 

                                For this measure, Battelle reviewed the following publicly available datasets at Benchmarks - QPP:

                                • 2026 MIPS Quality Benchmarks.csv (referred to as year 2024 in this assessment)
                                • 2025 MIPS Quality Benchmarks.csv (referred to as year 2023 in this assessment)
                                • 2024 MIPS Quality Benchmarks.csv (referred to as year 2022 in this assessment)
                                • 2023 MIPS Quality Benchmarks.csv (referred to as year 2021 in this assessment)

                                Battelle analyzed benchmark values for “Measure_ID”=249 and “Collection Type”= MIPS CQM.


                                About Figure 1: Figure 1 is a boxplot that shows how rates have changed based on the most recent 4 years of data available. For each year, the boxplot displays a box with lines and dots to help visualize the range and distribution of rates. The dots represent the minimum and maximum rates, and the line connecting them shows the range of the rates. The box itself covers the middle 60% of the rates, from the 20th to the 80th percentile. A “+” sign shows the average rate. This type of graph makes overall trends in rates over time as well as the consistency and spread of the results easier to visualize.

                                Figure 1 (Measure Score by PY)
                                boxplot

                                Figure 1. Boxplot of Performance Rate by Year

                                Interpretation (Measure Score by PY)

                                Figure 1 Interpretation: In 2021 and 2022, all clinicians had a rate higher than 95%; however, in 2023 and 2024, more than 20% of clinicians had a rate less than 90%. Based on information within the benchmark files, it is not possible to determine if this decrease is due to greater variation from more clinicians reporting on the measure in later years or if rates decreased over time within the same clinician population. For this measure, a higher rate indicates better quality of care. 


                                About this Analysis (Score Distro)

                                About Table 1: Table 1 illustrates the distribution of rates across deciles in the most recent year of data available.

                                Table 1 (Score Distro)

                                Table 1. Importance (Decile by Performance Rate, FY2024) 


                                Mean

                                Decile 1

                                Decile 2

                                Decile 3

                                Decile 4

                                Decile 5

                                Decile 6

                                Decile 7

                                Decile 8

                                Decile 9

                                Decile 10

                                Rate99.584.0-86.086.0-88.088.0-90.090.0-92.092.0-94.094.0-96.096.0-98.098.0-99.099.0-100100
                                Interpretation (Score Distro)

                                Table 1 Interpretation: Nearly all clinicians have a performance rate greater than 85%, more than 70% of clinicians have a performance rate greater than 90%, and more than 10% of the clinicians have a performance rate of 100%.

                                  Importance Criterion Definition

                                  The Meaningfulness criterion will be evaluated as part of the full Preliminary Assessment available in September. 

                                    Criterion Definition

                                    This criterion will be evaluated as part of the full Preliminary Assessment available in September. 

                                      Criterion Definition

                                      This criterion will be evaluated as part of the full Preliminary Assessment available in September. 

                                      PA Type
                                      Performance and Impact Analysis (PIA)

                                      Breast Cancer Screening Recall Rates

                                      The Breast Cancer Screening Recall Rates measure calculates the percentage of beneficiaries with mammography or digital breast tomosynthesis (DBT) screening studies that are followed by a diagnostic mammography, DBT, ultrasound, or magnetic resonance imaging (MRI) of the breast in an outpatient or office setting within 45 days.

                                      CBE ID
                                      4220

                                      Compliance with Spontaneous Breathing Trial (SBT) by Day 2 of the LTCH Stay

                                      CMS Measures Inventory Tool (CMIT) ID
                                      00143-02-C-LTCHQR
                                      Steward Organization Group
                                      Centers for Medicare & Medicaid Services (CMS)
                                      Committee
                                      MSR Recommendation Group
                                        Measure Overview
                                          Use in CMS Programs
                                          CMS Program History
                                          • Finalized in the Long-Term Care Hospital Quality Reporting in 2017.
                                          • Implemented in the Long-Term Care Hospital Quality Reporting in 2019.
                                          Description

                                          This measure assesses facility-level compliance with Spontaneous Breathing Trial (SBT), including Tracheostomy Collar Trial (TCT) or Continuous Positive Airway Pressure (CPAP) breathing trial, by Day 2 of the Long-Term Care Hospital (LTCH) stay for patients on invasive mechanical ventilation support upon admission, and for whom at admission weaning attempts were expected or anticipated at admission. This measure will be computed and reported separately according to each of the following components:

                                          • Component 1: Percentage of LTCH Stays in Which Patients Were Assessed for Readiness for SBT by Day 2 of the LTCH Stay
                                          • Component 2: Percentage of LTCH Stays in Which Patients Were Ready for SBT Who Received SBT by Day 2 of LTCH Stay.
                                          Numerator

                                          Component 1: LTCH stays in which patients are admitted on invasive mechanical ventilation for whom the LTCH Admission assessment (A0250 = [01]) indicates:

                                          • Completed assessment for readiness for SBT by day 2 of the LTCH stay (O0150B = [1] (yes)) and were either deemed medically ready (O0150C = [1] (yes)) OR
                                          • Medically unready, with documentation of reason(s) (O0150D = [1](Yes)). 

                                          Component 2: LTCH stays in which patients are admitted on invasive mechanical ventilation for whom the LTCH Admission assessment (A0250 = [01]) indicates SBT performed by day 2 of the LTCH stay (O0150E = [1](yes)).

                                          Numerator Exclusions

                                          N/A

                                          Numerator Exceptions

                                          N/A

                                          Denominator

                                          Component 1: LTCH stays in which patients who were on invasive mechanical ventilation support upon admission to an LTCH, for whom weaning attempts are expected or anticipated (for LTCH stays with admission date from 07/01/2018 through 09/30/2022: O0150A = [1] (yes, on weaning); for LTCH stays with admission date on and after 10/01/2022: O0150A = [1] (yes, on ventilation) and O0150A2 = [1] (yes, weaning)).

                                          Component 2: The subset of LTCH stays in which patients in the numerator of Component 1 were assessed and deemed ready for SBT by Day 2 of the LTCH stay (O0150B = [1] (yes) and O0150C = [1] (yes)).

                                          Denominator Exclusions

                                          LTCH stay is excluded from both Component 1 and Component 2 if:

                                          1. LTCH stay is missing data to calculate the measure (for LTCH stays with admission date from 07/01/2018 through 09/30/2022: O0150A = [-]; for stays with admission date on and after 10/01/2022: O0150A = [-] or O0150A2 = [-]), OR

                                          2. LTCH stays in which weaning attempts are not expected or anticipated at admission for the patient (for LTCH stays with admission date from 07/01/2018 through 09/30/2022: O0150A = [0] (No, not invasive mechanical ventilation support), or O0150A = [2] (Yes, non-weaning); for LTCH stays with admission date on and after 10/01/2022: O0150A = [0] (No, not invasive mechanical ventilation support), or O0150A = [1] and O150A2 = [0] (Yes, non-weaning)).

                                          Denominator Exceptions

                                          N/A

                                          Cascade of Meaningful Measures Priority
                                          Measure Type
                                          Process
                                          Level of Analysis
                                          Facility
                                          Care Setting
                                          Hospital: Long-Term Care
                                          CBE Endorsement Status
                                          Not Endorsed
                                          CBE Endorsement History

                                          N/A

                                            About this Analysis (Measure Score by PY)

                                            Impact Summary: This measure supports the Long‑Term Care Hospital (LTCH) Quality Reporting Program goal of measuring and improving the quality of care provided in long‑term care hospitals by assessing LTCH compliance with timely spontaneous breathing trials for patients on mechanical ventilation, a key clinical practice that informs ventilator management, supports care coordination, and improves outcomes for medically complex patients with prolonged hospital stays. 

                                            Hospital performance has stayed steady for Component 1 from 2023 to 2024 and increased slightly for Component 2 from 2023 to 2024. For Component 1, the measure identified 23,000 eligible patients assessed for readiness for SBT. Improving performance among lower-scoring hospitals could help ensure about 1,100 patients are assessed for readiness, or about four per entity, potentially leading to better health outcomes. For Component 2, the measure identified 19,100 eligible patients assessed for readiness for SBT. Improving performance among lower-scoring hospitals may help less than two patients per entity; therefore, a benefit may not exceed the entity-level burden of quality data collection.

                                            For this measure, Battelle reviewed the following publicly available datasets available at Long-Term Care Hospital - Provider Data | Provider Data Catalog (cms.gov):

                                            • long-term_care_hospitals_03_2026.zip (which contains data from April 2024-March 2025 and is referred to as year 2024 in this assessment)
                                            • long-term_care_hospitals_03_2025.zip (which contains data from April 2023-March 2024 and is referred to as year 2023 in this assessment)

                                            Battelle analyzed all values for “L_022_02” not marked as “Not Available” from the corresponding Long-term_Care_Hospital-Provider_Data.csv file. We analyzed rates for Component 1 and Component 2 separately.


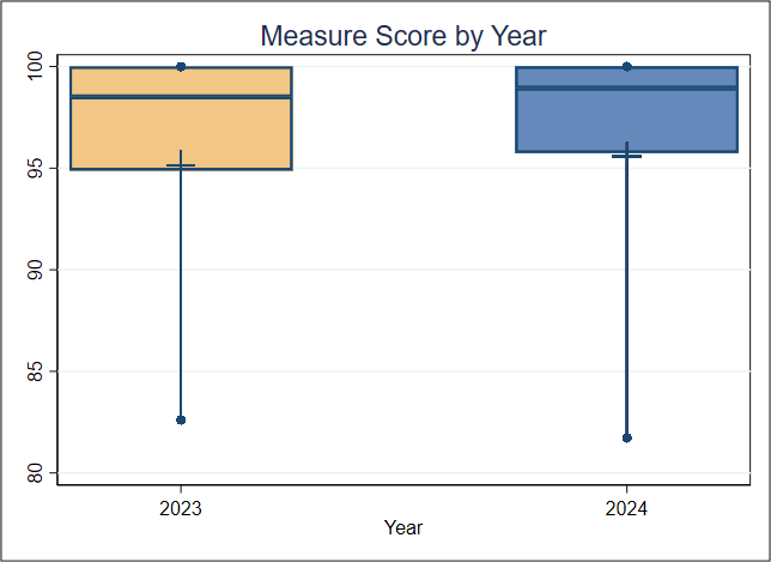
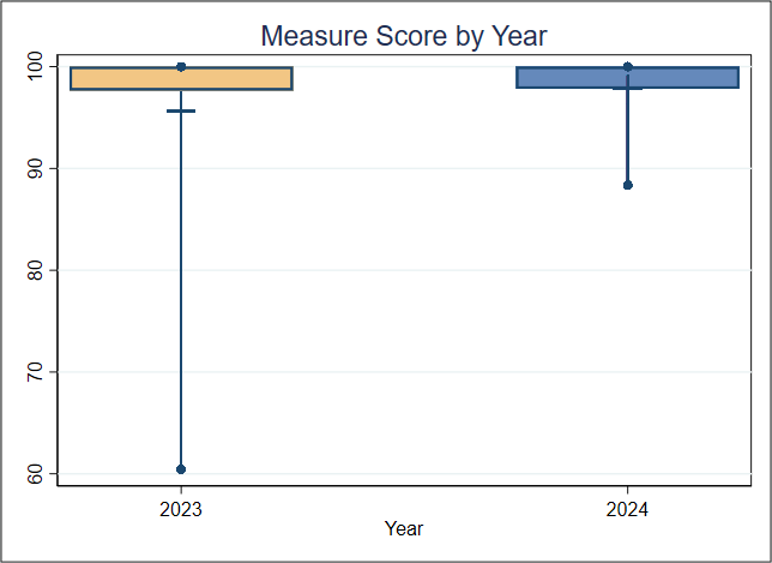
                                            About Figure 1: Figures 1a and 1b are boxplots that show how scores have changed based on the most recent 2 years of data available. For each year, the boxplot displays a box with lines and dots to help visualize the range and distribution of scores. The dots represent the points where the lowest 5% and highest 5% of scores fall, and the line connecting them shows where 90% of the scores are located. The box itself covers the middle half of the scores, from the 25th to the 75th percentile. Inside the box, a horizontal line marks the median score, which is the middle value, while a “+” sign shows the average score. This type of graph makes overall trends in scores over time as well as the consistency and spread of the results easier to understand.

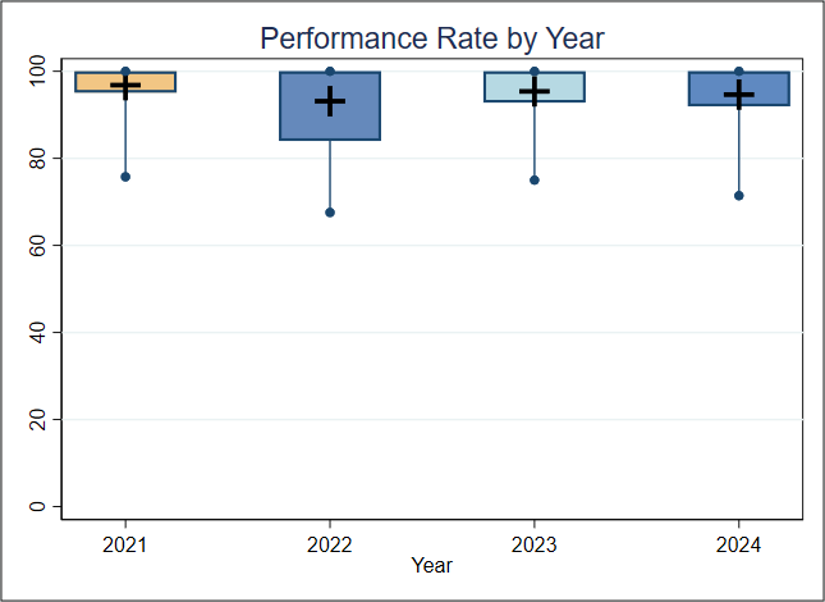
                                            Figure 1 (Measure Score by PY)
                                            boxplot

                                            Figure 1a. Boxplot of Measure Performance Rate by Year (Component 1)

                                            boxplot

                                            Figure 1b. Boxplot of Measure Performance Rate by Year (Component 2)

                                            Interpretation (Measure Score by PY)

                                            Figure 1a and 1b Interpretation: Figure 1a shows little discernible change between 2023 and 2024. Although the median value for Component 2 is 100% for both years, in Figure 1b the mean value increases slightly from 95.6% in 2023 to 97.8% in 2024. The mean in 2023 was lower because about 5% of the entities had a score of less than 60% whereas only one entity had a performance rate less than 60% in 2024. For these measures, a higher performance rate indicates better quality of care.


                                            About this Analysis (Score Distro)

                                            About Table 1: Tables 1a and 1b illustrate the distribution of performance rates and the population represented within each group for each component. It is important to note that the groups (referred to as deciles, each comprising 10% of the organizations) with the lowest or highest rates may contain smaller or larger populations than other groups. For example, if the lowest-scoring decile includes only 5% of the total population, then smaller group size may be associated with lower performance rates.

                                            Table 1 (Score Distro)

                                            Table 1a. Importance (Decile by Measure Performance Rate, 2024) in the Most Recent Year of Data Available – Component 1

                                             OverallDecile 1Decile 2Decile 3Decile 4Decile 5Decile 6Decile 7Decile 8Decile 9Decile 10
                                            Average Score (Standard Deviation)

                                            95.6 (11.3)

                                            72.5

                                            92.7

                                            95.8

                                            97.4

                                            98.4

                                            99.4

                                            100

                                            100

                                            100

                                            100

                                            Entities

                                            264

                                            27

                                            26

                                            27

                                            26

                                            26

                                            27

                                            26

                                            27

                                            26

                                            26

                                            Patients

                                            24,059

                                            2,416

                                            2,354

                                            2,523

                                            2,183

                                            3,003

                                            4,291

                                            1,820

                                            1,815

                                            1,924

                                            1,730


                                            Table 1b. Importance (Decile by Measure Performance Rate, 2024) in the Most Recent Year of Data Available – Component 2

                                             OverallDecile 1Decile 2Decile 3Decile 4Decile 5Decile 6Decile 7Decile 8Decile 9Decile 10
                                            Average Score (Standard Deviation)

                                            97.8 (5.6)

                                            84.9

                                            96.1

                                            97.9

                                            99.4

                                            100

                                            100

                                            100

                                            100

                                            100

                                            100

                                            Entities

                                            246

                                            25

                                            25

                                            24

                                            25

                                            24

                                            25

                                            25

                                            24

                                            25

                                            24

                                            Patients

                                            19,540

                                            2,018

                                            1,815

                                            1,821

                                            3,008

                                            1,565

                                            1,940

                                            2,395

                                            1,758

                                            1,650

                                            1,570

                                            Interpretation (Score Distro)

                                            Table 1a and 1b Interpretation: To estimate the number of positive outcomes, the number of patients is multiplied by the average rate for each decile. In 2024, for Component 1, the total estimated number of positive outcomes (eligible patients assessed for readiness for SBT) across all deciles is about 23,000. If the average performance of decile 8 (100%) is considered a plausible, achievable score, and the entities in deciles 1 through 7 improved to reach that score, about 1,000 additional positive outcomes could occur. This translates to about four patients per entity and means that improving performance on this measure could help ensure that several hundred more patients are assessed for readiness, potentially leading to better health outcomes. For Component 2, the total estimated number of positive outcomes (eligible patients who received SBT) across all deciles is about 19,100. If the average performance of decile 8 (100%) is considered a plausible, achievable score, and the entities in deciles 1 through 7 improved to reach that rate, about 400 additional patients would receive SBT, which translates to less than two patients per entity. 

                                              Importance Criterion Definition

                                              The Meaningfulness criterion will be evaluated as part of the full Preliminary Assessment available in September. 

                                                Criterion Definition

                                                This criterion will be evaluated as part of the full Preliminary Assessment available in September. 

                                                  Criterion Definition

                                                  This criterion will be evaluated as part of the full Preliminary Assessment available in September. 

                                                  PA Type
                                                  Performance and Impact Analysis (PIA)

                                                  CVD Risk Assessment Measure – Proportion of Pregnant/Postpartum Patients That Receive CVD Risk Assessment with a Standardized Tool

                                                  The University of California, Irvine (UCI) implemented and tested a CVD risk assessment algorithm that can be integrated into the electronic health record (EHR) system that immediately identifies patients who are at increased risk for CVD. The unit of measurement is individual patients, and the population will include any patient who has a prenatal or postpartum visit in the hospital system. This includes pregnant and postpartum emancipated minors.
                                                  CBE ID
                                                  3716

                                                  CVD Risk Follow-up Measure - Proportion of patients with a positive CVD risk assessment who receive follow-up care

                                                  All pregnant and postpartum patients need to be systematically assessed for cardiovascular disease (CVD). Once identified as being at risk for CVD follow-up cardiac tests and consultations are scheduled. UCI implemented and tested a standardized CVD risk assessment algorithm that can be integrated into the EHR system and provides an immediate triage of patients as low and high risk for CVD.
                                                  CBE ID
                                                  3735