Breadcrumb

  1. Home

Long-Term Care Hospital Quality Reporting

Advance Care Planning (ACP)

Percentage of patients aged 18 years and older at the start of the measurement period with one or more inpatient encounters during the measurement period who have an advance care planning document or documentation of an advance care planning discussion resulting in a documented decision in the electronic health record (EHR) by the time of hospital discharge for at least one hospital encounter during the measurement period.  

Catheter-Associated Urinary Tract Infection (CAUTI) Standardized Infection Ratio

CMS Measures Inventory Tool (CMIT) ID
00459-01-C-LTCHQR
Steward Organization Group
Centers for Disease Control and Prevention
Committee
MSR Recommendation Group
    Measure Overview
      Use in CMS Programs
      CMS Program History
      • Finalized for inclusion in the Long-Term Care Hospital Quality Reporting Program in 2011. 
      • Implemented in the Long-Term Care Hospital Quality Reporting Program in 2013.
      • Also active in the Inpatient Rehabilitation Facility Quality Reporting Program and the PPS-Exempt Cancer Hospital Quality Reporting (PCHQR) Program.
      Description

      Annual risk-adjusted standardized infection ratio (SIR) of catheter-associated urinary tract infections (CAUTI) among adults and children hospitalized as inpatients at acute care hospitals, critical access hospitals, oncology hospitals, long-term acute care hospitals, and acute care rehabilitation hospitals. SIR is reported annually and is calculated by dividing the number of observed CAUTIs by the number of predicted CAUTIs.

      Numerator

      Number of annually observed catheter-associated urinary tract infections (CAUTI) in hospital inpatients. 

      Numerator Exclusions

      N/A

      Numerator Exceptions

      N/A

      Denominator

      Number of annually predicted catheter-associated urinary tract infections (CAUTI) in hospital inpatients.  

      Denominator Exclusions

      The following are not considered indwelling catheters by NHSN definitions:

      • Suprapubic catheters
      • Condom catheters
      • “In and out” catheterizations
      • Nephrostomy tubes
      • Ileoconduits 
      Denominator Exceptions

      N/A

      Cascade of Meaningful Measures Priority
      Measure Type
      Outcome
      Level of Analysis
      Facility
      Care Setting
      Hospital: Inpatient Acute Care Facility
      PPS-Exempt Cancer Hospital
      Hospital: Outpatient
      Inpatient Rehabilitation Facility
      Long-Term Acute Care Facility
      CBE Endorsement Status
      Endorsed with Conditions
      CBE Endorsement History

      Endorsement History: 

      • Initial endorsement, 2012.
      • New measure endorsed with conditions Spring 2025.

      Link to Endorsement Measure Record: National Healthcare Safety Network (NHSN) Catheter-Associated Urinary Tract Infection (CAUTI) Outcome Measure

        About this Analysis (Measure Score by PY)

        Impact Summary: This measure supports the Long-Term Care Hospital Quality Reporting Program by assessing health care-associated catheter-associated urinary tract infections (CAUTI) among patients in bedded long-term care hospitals, an outcome directly associated with patient safety and quality of care. 

        There was no discernible change in performance among entities reporting on this measure during the years examined. Based on the most recent data, the total estimated number of CAUTIs across all deciles is approximately 1,400. If long-term care hospitals with higher CAUTI rates improved their performance to levels observed among better-performing facilities, the analysis suggests that up to about 1,000 CAUTIs could potentially be avoided, representing a meaningful opportunity for improved patient outcomes.

        For this measure, Battelle reviewed the following publicly available datasets available at Long-Term Care Hospital - Provider Data | Provider Data Catalog (cms.gov)

        • long-term_care_hospitals_03_2026.zip (which contains data from April 2024-March 2025 and is referred to as year 2024 in this assessment)
        • long-term_care_hospitals_03_2025.zip (which contains data from April 2023-March 2024 and is referred to as year 2023 in this assessment)
        • long-term_care_hospitals_03_2024.zip (which contains data from April 2022-March 2023 and is referred to as year 2022 in this assessment)
        • long-term_care_hospitals_03_2023.zip (which contains data from April 2021-March 2022 and is referred to as year 2021 in this assessment)

        Battelle analyzed all values for “L_006_01” not marked as “Not Available” from the corresponding Long-term_Care_Hospital-Provider_Data.csv file.


        About Figure 1: Figure 1 is a boxplot that shows how scores have changed based on the most recent 4 years of data available. For each year, the boxplot displays a box with lines and dots to help visualize the range and distribution of scores. The dots represent the points where the lowest 5% and highest 5% of scores fall, and the line connecting them shows where 90% of the scores are located. The box itself covers the middle half of the scores, from the 25th to the 75th percentile. Inside the box, a horizontal line marks the median score, which is the middle value, while a “+” sign shows the average score. This type of graph makes overall trends in scores over time as well as the consistency and spread of the results easier to understand.

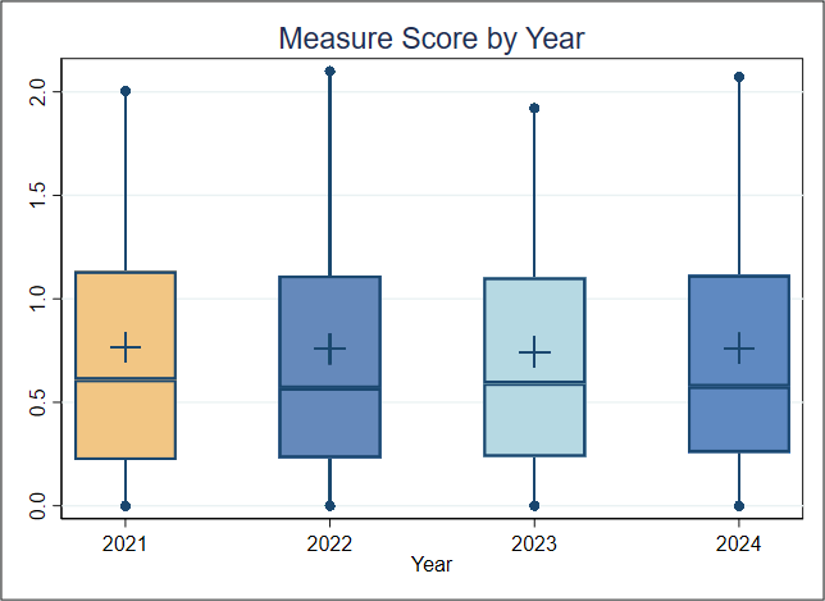
        Figure 1 (Measure Score by PY)
        boxplot


        Figure 1. Boxplot of Measure Score by Year

        Interpretation (Measure Score by PY)

        Figure 1 Interpretation: There is no discernible change across the 4 years; the median score had a range between a minimum of 0.57 to a maximum of 0.61. For this measure, a lower score indicates better quality of care.

        About this Analysis (Score Distro)

        About Table 1: Table 1 illustrates the distribution of scores (standardized infection ratios [SIRs]), raw rates, and the number of patients represented within each group. It is important to note that the groups (referred to as deciles, each comprising 10% of the organizations) with the lowest or highest scores may contain more or fewer patients than other groups. For example, if the lowest-scoring decile includes only 5% of the total patient population, this smaller group size may be associated with lower performance scores.

        For this measure, Decile 1 represents a group of 32 hospitals with the highest measure scores and Decile 10 shows those with the lowest measure scores. 

        Table 1 (Score Distro)

        Table 1. Importance in the Most Recent Year of Data Available (Decile by Measure Score, FY2024) 

         OverallDecile 1Decile 2Decile 3Decile 4Decile 5Decile 6Decile 7Decile 8Decile 9Decile 10
        Average SIR (Standard Deviation)

        0.760 (0.730)

        0

        0

        0.233

        0.425

        0.515

        0.651

        0.902

        1.19

        1.409

        2.217

        Average Raw Rate (Standard Deviation)

        0.130 (0.122)

        0

        0

        0.037

        0.067

        0.089

        0.111

        0.147

        0.192

        0.241

        0.394

        Entities

        312

        32

        31

        31

        31

        31

        32

        31

        31

        31

        31

        Patients

        1,058,542

        76,535

        74,451

        125,653

        106,053

        125,180

        115,518

        110,660

        101,551

        107,002

        115,939

        Interpretation (Score Distro)

        Table 1 Interpretation: To estimate the number of negative outcomes (CAUTIs), the number of patients is multiplied by the average raw rate for each decile. In 2024, the total estimated number of negative outcomes across all deciles is about 1,400. If the average performance of Decile 3 (0.037%) is considered a plausible, achievable score, and the entities in Deciles 4 through 10 improved to reach that score, about 1,000 fewer negative outcomes could occur. This translates to about three patients per entity and means that improving performance on this measure could help ensure that several hundred fewer patients contract CAUTIs, potentially leading to better health outcomes.

          Importance Criterion Definition

          The Meaningfulness criterion will be evaluated as part of the full Preliminary Assessment available in September. 

            Criterion Definition

            This criterion will be evaluated as part of the full Preliminary Assessment available in September. 

              Criterion Definition

              This criterion will be evaluated as part of the full Preliminary Assessment available in September. 

              PA Type
              Performance and Impact Analysis (PIA)

              Central Line-Associated Bloodstream Infection (CLABSI) Standardized Infection Ratio

              CMS Measures Inventory Tool (CMIT) ID
              00460-01-C-LTCHQR
              Steward Organization Group
              Centers for Disease Control and Prevention
              Committee
              MSR Recommendation Group
                Measure Overview
                  Use in CMS Programs
                  CMS Program History
                  • Finalized for inclusion in the Long-Term Care Hospital Quality Reporting Program in 2011. 
                  • Implemented in the Long-Term Care Hospital Quality Reporting Program in 2013.
                  • Also active in the PPS-Exempt Cancer Hospital Quality Reporting (PCHQR) Program.
                  Description

                  Annual risk-adjusted standardized infection ratio (SIR) of central line-associated bloodstream infections (CLABSI) among adults and children hospitalized as inpatients at acute care hospitals, critical access hospitals, oncology hospitals, and long-term acute care hospitals. SIR is reported annually and is calculated by dividing the number of observed CLABSIs by the number of predicted CLABSIs.  

                  Numerator

                  Number of annually observed central line-associated bloodstream infections (CLABSI) in hospital inpatients. 

                  Numerator Exclusions

                  N/A

                  Numerator Exceptions

                  N/A

                  Denominator

                  Number of annually predicted central-line associated bloodstream infections (CLABSI) in hospital inpatients. 

                  Denominator Exclusions

                  The following devices are not considered central lines and are excluded:  

                  • Arterial catheters unless in the pulmonary artery, aorta or umbilical artery 
                  • Arteriovenous fistula  
                  • Arteriovenous graft  
                  • Extracorporeal life support (ECMO)  
                  • Hemodialysis reliable outflow (HERO) dialysis catheter  
                  • Intra-aortic balloon pump (IABP) devices  
                  • Peripheral IV or Midlines  
                  • Ventricular Assist Device (VAD) 

                  CLABSI events reported to NHSN as mucosal barrier injury laboratory-confirmed bloodstream infections (MBI-LCBIs) are excluded.  

                  Denominator Exceptions

                  N/A

                  Cascade of Meaningful Measures Priority
                  Measure Type
                  Outcome
                  Level of Analysis
                  Facility
                  Care Setting
                  Hospital: Inpatient Acute Care Facility
                  Hospital: Long-Term Care
                  PPS-Exempt Cancer Hospital
                  Hospital: Outpatient
                  CBE Endorsement Status
                  Endorsed
                  CBE Endorsement History

                  Endorsement History: 

                  • The measure was first endorsed in 2012. 
                  • Measure retained endorsement in 2025 through maintenance cycle as new measure ID CBE #0139.

                  Link to Endorsement Measure Record: Catheter-Associated Urinary Tract Infection (CAUTI) Standardized Infection Ratio | Partnership for Quality Measurement

                    About this Analysis (Measure Score by PY)

                    Impact Summary: This measure supports the Long-Term Care Hospital Quality Reporting Program by assessing health care–associated central line–associated bloodstream infections (CLABSIs) among patients in long-term care hospitals, an outcome closely associated with patient safety and infection prevention. 

                    Based on the most recent data, the total estimated number of CLABSIs across all deciles is approximately 1,200. If long-term care hospitals with higher CLABSI rates improved their performance to levels observed among better-performing facilities, the analysis suggests that up to about 1,000 CLABSIs could potentially be avoided, indicating a substantial opportunity for improved patient outcomes.

                    For this measure, Battelle reviewed the following publicly available datasets available at Long-Term Care Hospital - Provider Data | Provider Data Catalog (cms.gov):

                    • long-term_care_hospitals_03_2026.zip (which contains data from April 2024-March 2025 and is referred to as year 2024 in this assessment)
                    • long-term_care_hospitals_03_2025.zip (which contains data from April 2023-March 2024 and is referred to as year 2023 in this assessment)
                    • long-term_care_hospitals_03_2024.zip (which contains data from April 2022-March 2023 and is referred to as year 2022 in this assessment)
                    • long-term_care_hospitals_03_2023.zip (which contains data from April 2021-March 2022 and is referred to as year 2021 in this assessment)

                    Battelle analyzed all values for “L_007_01” not marked as “Not Available” from the corresponding Long-term_Care_Hospital-Provider_Data.csv file.


                    About Figure 1: Figure 1 is a boxplot that shows how scores have changed based on the most recent 4 years of data available. For each year, the boxplot displays a box with lines and dots to help visualize the range and distribution of scores. The dots represent the points where the lowest 5% and highest 5% of scores fall, and the line connecting them shows where 90% of the scores are located. The box itself covers the middle half of the scores, from the 25th to the 75th percentile. Inside the box, a horizontal line marks the median score, which is the middle value, while a “+” sign shows the average score. This type of graph makes overall trends in scores over time as well as the consistency and spread of the results easier to understand.
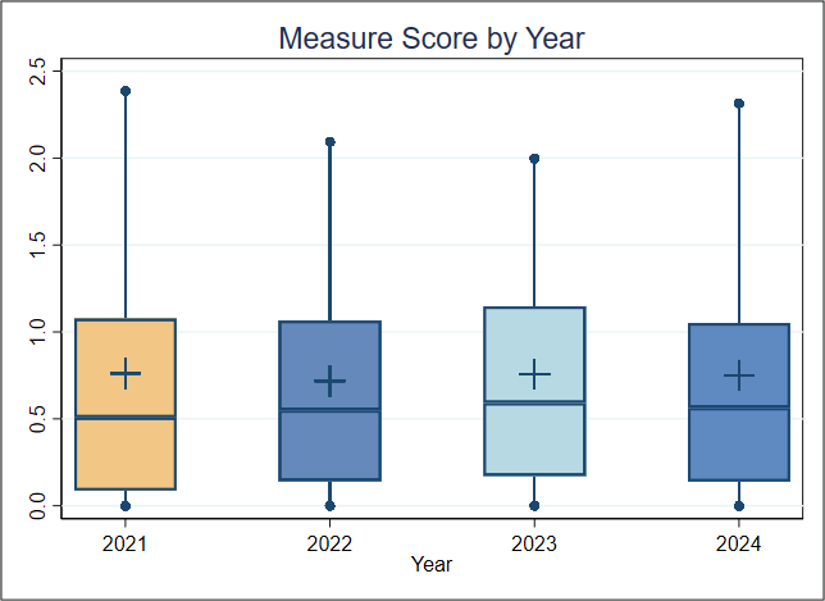
                    Figure 1 (Measure Score by PY)
                    boxplot

                    Figure 1. Boxplot of Measure Score by Year

                    Interpretation (Measure Score by PY)

                    Figure 1 Interpretation: There is little discernible change across the 4 years; the median score ranged between a minimum of 0.51 to a maximum of 0.59. For this measure, a lower score indicates better quality of care.

                    About this Analysis (Score Distro)

                    About Table 1: Table 1 illustrates the distribution of scores (standardized infection ratio [SIR]), raw rates, and the number of patients represented within each group. It is important to note that the groups (referred to as deciles, each comprising 10% of the organizations) with the lowest or highest scores may contain more or fewer patients than other groups. For example, if the lowest-scoring decile includes only 5% of the total patient population, this smaller group size may be associated with lower performance scores.

                    Table 1 (Score Distro)

                    Table 1. Importance (Decile by Measure Score, FY2024) 

                     OverallDecile 1Decile 2Decile 3Decile 4Decile 5Decile 6Decile 7Decile 8Decile 9Decile 10
                    Average SIR (Standard Deviation)

                    0.750 (0.815)

                    0

                    0

                    0.121

                    0.308

                    0.531

                    0.661

                    0.854

                    1.037

                    1.500

                    2.500

                    Average Raw Rate (Standard Deviation)

                    0.090 (0.137)

                    0

                    0

                    0.011

                    0.036

                    0.054

                    0.074

                    0.099

                    0.124

                    0.176

                    0.361

                    Entities

                    312

                    32

                    31

                    31

                    31

                    31

                    32

                    31

                    31

                    31

                    31

                    Patients

                    1,230,531

                    100,154

                    69,485

                    131,684

                    142,337

                    125,319

                    153,281

                    129,301

                    150,564

                    109,106

                    119,300

                    Interpretation (Score Distro)

                    Table 1 Interpretation: To estimate the number of negative outcomes (CLABSIs), the number of patients is multiplied by the average raw rate for each decile. In 2024, the total estimated number of negative outcomes across all deciles is about 1,200. If the average performance of Decile 3 (0.011%) is considered a plausible, achievable score, and the entities in Deciles 4 through 10 improved to reach that score, about 1,000 fewer negative outcomes could occur. This translates to about three patients per entity and means that improving performance on this measure could help ensure that several hundred fewer patients contract CLABSIs, potentially leading to better health outcomes.

                      Importance Criterion Definition

                      The Meaningfulness criterion will be evaluated as part of the full Preliminary Assessment available in September. 

                        Criterion Definition

                        This criterion will be evaluated as part of the full Preliminary Assessment available in September. 

                          Criterion Definition

                          This criterion will be evaluated as part of the full Preliminary Assessment available in September. 

                          PA Type
                          Performance and Impact Analysis (PIA)

                          Clostridioides difficile (CDI) LabID Event Standardized Infection Ratio

                          CMS Measures Inventory Tool (CMIT) ID
                          00462-01-C-LTCHQR
                          Steward Organization Group
                          Centers for Disease Control and Prevention
                          Committee
                          MSR Recommendation Group
                            Measure Overview
                              Use in CMS Programs
                              CMS Program History
                              • Finalized for inclusion in the Long-Term Care Hospital Quality Reporting Program in 2013. 
                              • Implemented in the Long-Term Care Hospital Quality Reporting Program in 2016.
                              • Also active in the Inpatient Rehabilitation Facility Quality Reporting Program and the PPS-Exempt Cancer Hospital Quality Reporting (PCHQR) Program.
                              Description

                              Annual risk-adjusted standardized infection ratio (SIR) of Clostridioides difficile (CDI) LabID events among adults and pediatrics hospitalized as inpatients at acute care hospitals, oncology hospitals, long-term acute care hospitals, and acute care rehabilitation hospitals.  SIR is reported annually and is calculated by dividing the number of observed CDIs into the number of predicted CDIs.  

                              Numerator

                              Number of annually observed Clostridioides difficile (CDI) LabID events in hospital inpatients. 

                              Numerator Exclusions

                              N/A

                              Numerator Exceptions

                              N/A

                              Denominator

                              Number of annually predicted Clostridioides difficile (CDI) LabID events in hospital inpatients.    

                              Denominator Exclusions

                              Baby based locations such as neonatal ICU, special care nursery and well-baby nurseries, are excluded from the denominator count. In LDRP locations, moms and babies must each be counted separately (as two patients). Any locations that predominantly house infants, including NICU, SCN, or well-baby locations (for example, nurseries, babies in LDRP) are excluded. 

                              Denominator Exceptions

                              N/A

                              Cascade of Meaningful Measures Priority
                              Measure Type
                              Outcome
                              Level of Analysis
                              Facility
                              Care Setting
                              Long-Term Acute Care Facility
                              CBE Endorsement Status
                              Endorsed
                              CBE Endorsement History

                              Endorsement History: The measure was last endorsed in 2025 and is up for re-endorsement in 2029 

                              Link to Endorsement Measure Record: Clostridioides difficile (CDI) LabID Event Standardized Infection Ratio | Partnership for Quality Measurement

                                About this Analysis (Measure Score by PY)

                                Impact Summary: This measure supports the Long-Term Care Hospital Quality Reporting Program by assessing facility-wide hospital-onset Clostridioides difficile infections (CDIs) among patients in long-term care hospitals, an outcome closely associated with patient safety and infection prevention. 

                                Based on the most recent data, the total estimated number of CDIs across all deciles is approximately 1,000. If long-term care hospitals with higher CDI rates improved their performance to levels observed among better-performing facilities, the analysis suggests that several hundred CDIs could potentially be avoided, indicating a meaningful opportunity for improved patient outcomes.

                                For this measure, Battelle reviewed the following publicly available datasets available at Long-Term Care Hospital - Provider Data | Provider Data Catalog (cms.gov):

                                • long-term_care_hospitals_03_2026.zip (which contains data from April 2024-March 2025 and is referred to as year 2024 in this assessment)
                                • long-term_care_hospitals_03_2025.zip (which contains data from April 2023-March 2024 and is referred to as year 2023 in this assessment)
                                • long-term_care_hospitals_03_2024.zip (which contains data from April 2022-March 2023 and is referred to as year 2022 in this assessment)
                                • long-term_care_hospitals_03_2023.zip (which contains data from April 2021-March 2022 and is referred to as year 2021 in this assessment)

                                Battelle analyzed all values for “L_014_01” not marked as “Not Available” from the corresponding Long-term_Care_Hospital-Provider_Data.csv file.


                                About Figure 1: Figure 1 is a boxplot that shows how scores have changed based on the most recent 4 years of data available. For each year, the boxplot displays a box with lines and dots to help visualize the range and distribution of scores. The dots represent the points where the lowest 5% and highest 5% of scores fall, and the line connecting them shows where 90% of the scores are located. The box itself covers the middle half of the scores, from the 25th to the 75th percentile. Inside the box, a horizontal line marks the median score, which is the middle value, while a “+” sign shows the average score. This type of graph makes overall trends in scores over time as well as the consistency and spread of the results easier to understand.
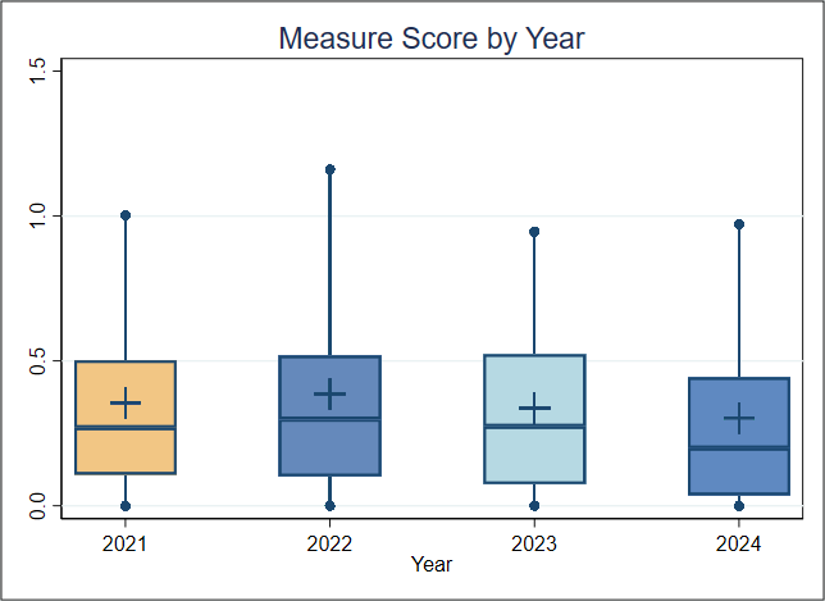
                                Figure 1 (Measure Score by PY)
                                boxplot


                                Figure 1. Boxplot of Measure Score by Year

                                Interpretation (Measure Score by PY)

                                Figure 1 Interpretation: Although there was no discernible change from 2021 to 2022, Figure 1 shows a decreasing trend from a median standardized infection ratio (SIR) of 0.3 in 2022 to a median SIR of 0.2 in 2024. For this measure, a lower score indicates better quality of care.

                                About this Analysis (Score Distro)

                                About Table 1: Table 1 illustrates the distribution of scores (SIRs), raw rates, and the number of patients represented within each group. It is important to note that the groups (referred to as deciles, each comprising 10% of the organizations) with the lowest or highest scores may contain more or fewer patients than other groups. For example, if the lowest-scoring decile includes only 5% of the total patient population, then smaller group size may be associated with lower performance scores.

                                Table 1 (Score Distro)

                                Table 1. Importance (Decile by Measure Score, FY2024) 

                                 OverallDecile 1Decile 2Decile 3Decile 4Decile 5Decile 6Decile 7Decile 8Decile 9Decile 10
                                Average SIR (Standard Deviation)

                                0.300 (0.335)

                                0

                                0

                                0.036

                                0.110

                                0.173

                                0.241

                                0.317

                                0.461

                                0.655

                                1.049

                                Average Raw Rate (Standard Deviation)

                                0.030 (0.030)

                                0

                                0

                                0.003

                                0.011

                                0.016

                                0.021

                                0.029

                                0.042

                                0.059

                                0.095

                                Entities

                                312

                                32

                                31

                                31

                                31

                                31

                                32

                                31

                                31

                                31

                                31

                                Patients

                                4,207,696

                                304,536

                                206,866

                                852,566

                                449,200

                                482,814

                                466,775

                                363,369

                                434,037

                                325,420

                                322,113

                                Interpretation (Score Distro)

                                Table 1 Interpretation: To estimate the number of negative outcomes (CDIs), the number of patients is multiplied by the average raw rate for each decile. Right now, the total estimated number of negative outcomes across all deciles is about 1,000. If the average performance of Decile 3 (0.003%) is considered a plausible, achievable score, and the entities in Deciles 4 through 10 improved to reach that score, about 900 fewer negative outcomes could occur. This translates to about three patients per entity and means that improving performance on this measure could help ensure that several hundred fewer patients contract CDIs, potentially leading to better health outcomes.

                                  Importance Criterion Definition

                                  The Meaningfulness criterion will be evaluated as part of the full Preliminary Assessment available in September. 

                                    Criterion Definition

                                    This criterion will be evaluated as part of the full Preliminary Assessment available in September. 

                                      Criterion Definition

                                      This criterion will be evaluated as part of the full Preliminary Assessment available in September. 

                                      PA Type
                                      Performance and Impact Analysis (PIA)

                                      Compliance with Spontaneous Breathing Trial (SBT) by Day 2 of the LTCH Stay

                                      CMS Measures Inventory Tool (CMIT) ID
                                      00143-02-C-LTCHQR
                                      Steward Organization Group
                                      Centers for Medicare & Medicaid Services (CMS)
                                      Committee
                                      MSR Recommendation Group
                                        Measure Overview
                                          Use in CMS Programs
                                          CMS Program History
                                          • Finalized in the Long-Term Care Hospital Quality Reporting in 2017.
                                          • Implemented in the Long-Term Care Hospital Quality Reporting in 2019.
                                          Description

                                          This measure assesses facility-level compliance with Spontaneous Breathing Trial (SBT), including Tracheostomy Collar Trial (TCT) or Continuous Positive Airway Pressure (CPAP) breathing trial, by Day 2 of the Long-Term Care Hospital (LTCH) stay for patients on invasive mechanical ventilation support upon admission, and for whom at admission weaning attempts were expected or anticipated at admission. This measure will be computed and reported separately according to each of the following components:

                                          • Component 1: Percentage of LTCH Stays in Which Patients Were Assessed for Readiness for SBT by Day 2 of the LTCH Stay
                                          • Component 2: Percentage of LTCH Stays in Which Patients Were Ready for SBT Who Received SBT by Day 2 of LTCH Stay.
                                          Numerator

                                          Component 1: LTCH stays in which patients are admitted on invasive mechanical ventilation for whom the LTCH Admission assessment (A0250 = [01]) indicates:

                                          • Completed assessment for readiness for SBT by day 2 of the LTCH stay (O0150B = [1] (yes)) and were either deemed medically ready (O0150C = [1] (yes)) OR
                                          • Medically unready, with documentation of reason(s) (O0150D = [1](Yes)). 

                                          Component 2: LTCH stays in which patients are admitted on invasive mechanical ventilation for whom the LTCH Admission assessment (A0250 = [01]) indicates SBT performed by day 2 of the LTCH stay (O0150E = [1](yes)).

                                          Numerator Exclusions

                                          N/A

                                          Numerator Exceptions

                                          N/A

                                          Denominator

                                          Component 1: LTCH stays in which patients who were on invasive mechanical ventilation support upon admission to an LTCH, for whom weaning attempts are expected or anticipated (for LTCH stays with admission date from 07/01/2018 through 09/30/2022: O0150A = [1] (yes, on weaning); for LTCH stays with admission date on and after 10/01/2022: O0150A = [1] (yes, on ventilation) and O0150A2 = [1] (yes, weaning)).

                                          Component 2: The subset of LTCH stays in which patients in the numerator of Component 1 were assessed and deemed ready for SBT by Day 2 of the LTCH stay (O0150B = [1] (yes) and O0150C = [1] (yes)).

                                          Denominator Exclusions

                                          LTCH stay is excluded from both Component 1 and Component 2 if:

                                          1. LTCH stay is missing data to calculate the measure (for LTCH stays with admission date from 07/01/2018 through 09/30/2022: O0150A = [-]; for stays with admission date on and after 10/01/2022: O0150A = [-] or O0150A2 = [-]), OR

                                          2. LTCH stays in which weaning attempts are not expected or anticipated at admission for the patient (for LTCH stays with admission date from 07/01/2018 through 09/30/2022: O0150A = [0] (No, not invasive mechanical ventilation support), or O0150A = [2] (Yes, non-weaning); for LTCH stays with admission date on and after 10/01/2022: O0150A = [0] (No, not invasive mechanical ventilation support), or O0150A = [1] and O150A2 = [0] (Yes, non-weaning)).

                                          Denominator Exceptions

                                          N/A

                                          Cascade of Meaningful Measures Priority
                                          Measure Type
                                          Process
                                          Level of Analysis
                                          Facility
                                          Care Setting
                                          Hospital: Long-Term Care
                                          CBE Endorsement Status
                                          Not Endorsed
                                          CBE Endorsement History

                                          N/A

                                            About this Analysis (Measure Score by PY)

                                            Impact Summary: This measure supports the Long‑Term Care Hospital (LTCH) Quality Reporting Program goal of measuring and improving the quality of care provided in long‑term care hospitals by assessing LTCH compliance with timely spontaneous breathing trials for patients on mechanical ventilation, a key clinical practice that informs ventilator management, supports care coordination, and improves outcomes for medically complex patients with prolonged hospital stays. 

                                            Hospital performance has stayed steady for Component 1 from 2023 to 2024 and increased slightly for Component 2 from 2023 to 2024. For Component 1, the measure identified 23,000 eligible patients assessed for readiness for SBT. Improving performance among lower-scoring hospitals could help ensure about 1,100 patients are assessed for readiness, or about four per entity, potentially leading to better health outcomes. For Component 2, the measure identified 19,100 eligible patients assessed for readiness for SBT. Improving performance among lower-scoring hospitals may help less than two patients per entity; therefore, a benefit may not exceed the entity-level burden of quality data collection.

                                            For this measure, Battelle reviewed the following publicly available datasets available at Long-Term Care Hospital - Provider Data | Provider Data Catalog (cms.gov):

                                            • long-term_care_hospitals_03_2026.zip (which contains data from April 2024-March 2025 and is referred to as year 2024 in this assessment)
                                            • long-term_care_hospitals_03_2025.zip (which contains data from April 2023-March 2024 and is referred to as year 2023 in this assessment)

                                            Battelle analyzed all values for “L_022_02” not marked as “Not Available” from the corresponding Long-term_Care_Hospital-Provider_Data.csv file. We analyzed rates for Component 1 and Component 2 separately.


                                            About Figure 1: Figures 1a and 1b are boxplots that show how scores have changed based on the most recent 2 years of data available. For each year, the boxplot displays a box with lines and dots to help visualize the range and distribution of scores. The dots represent the points where the lowest 5% and highest 5% of scores fall, and the line connecting them shows where 90% of the scores are located. The box itself covers the middle half of the scores, from the 25th to the 75th percentile. Inside the box, a horizontal line marks the median score, which is the middle value, while a “+” sign shows the average score. This type of graph makes overall trends in scores over time as well as the consistency and spread of the results easier to understand.
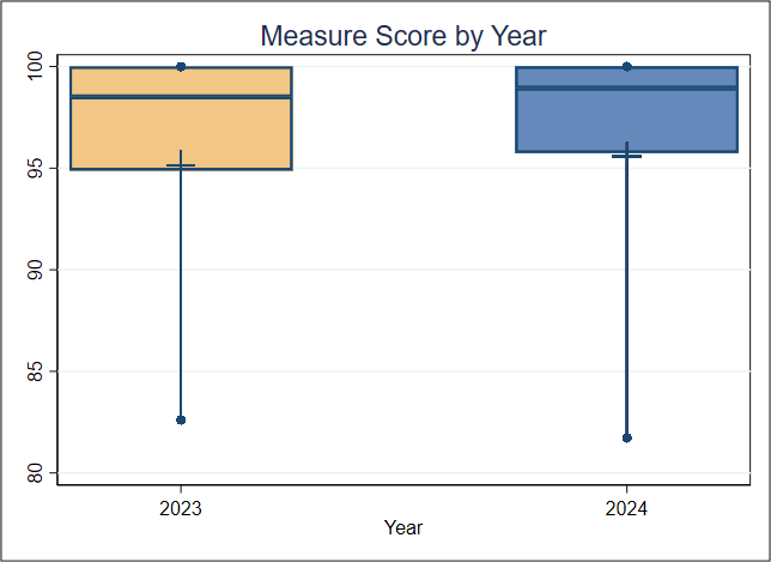
                                            Figure 1 (Measure Score by PY)
                                            boxplot

                                            Figure 1a. Boxplot of Measure Performance Rate by Year (Component 1)

                                            boxplot

                                            Figure 1b. Boxplot of Measure Performance Rate by Year (Component 2)

                                            Interpretation (Measure Score by PY)

                                            Figure 1a and 1b Interpretation: Figure 1a shows little discernible change between 2023 and 2024. Although the median value for Component 2 is 100% for both years, in Figure 1b the mean value increases slightly from 95.6% in 2023 to 97.8% in 2024. The mean in 2023 was lower because about 5% of the entities had a score of less than 60% whereas only one entity had a performance rate less than 60% in 2024. For these measures, a higher performance rate indicates better quality of care.


                                            About this Analysis (Score Distro)

                                            About Table 1: Tables 1a and 1b illustrate the distribution of performance rates and the population represented within each group for each component. It is important to note that the groups (referred to as deciles, each comprising 10% of the organizations) with the lowest or highest rates may contain smaller or larger populations than other groups. For example, if the lowest-scoring decile includes only 5% of the total population, then smaller group size may be associated with lower performance rates.

                                            Table 1 (Score Distro)

                                            Table 1a. Importance (Decile by Measure Performance Rate, 2024) in the Most Recent Year of Data Available – Component 1

                                             OverallDecile 1Decile 2Decile 3Decile 4Decile 5Decile 6Decile 7Decile 8Decile 9Decile 10
                                            Average Score (Standard Deviation)

                                            95.6 (11.3)

                                            72.5

                                            92.7

                                            95.8

                                            97.4

                                            98.4

                                            99.4

                                            100

                                            100

                                            100

                                            100

                                            Entities

                                            264

                                            27

                                            26

                                            27

                                            26

                                            26

                                            27

                                            26

                                            27

                                            26

                                            26

                                            Patients

                                            24,059

                                            2,416

                                            2,354

                                            2,523

                                            2,183

                                            3,003

                                            4,291

                                            1,820

                                            1,815

                                            1,924

                                            1,730


                                            Table 1b. Importance (Decile by Measure Performance Rate, 2024) in the Most Recent Year of Data Available – Component 2

                                             OverallDecile 1Decile 2Decile 3Decile 4Decile 5Decile 6Decile 7Decile 8Decile 9Decile 10
                                            Average Score (Standard Deviation)

                                            97.8 (5.6)

                                            84.9

                                            96.1

                                            97.9

                                            99.4

                                            100

                                            100

                                            100

                                            100

                                            100

                                            100

                                            Entities

                                            246

                                            25

                                            25

                                            24

                                            25

                                            24

                                            25

                                            25

                                            24

                                            25

                                            24

                                            Patients

                                            19,540

                                            2,018

                                            1,815

                                            1,821

                                            3,008

                                            1,565

                                            1,940

                                            2,395

                                            1,758

                                            1,650

                                            1,570

                                            Interpretation (Score Distro)

                                            Table 1a and 1b Interpretation: To estimate the number of positive outcomes, the number of patients is multiplied by the average rate for each decile. In 2024, for Component 1, the total estimated number of positive outcomes (eligible patients assessed for readiness for SBT) across all deciles is about 23,000. If the average performance of decile 8 (100%) is considered a plausible, achievable score, and the entities in deciles 1 through 7 improved to reach that score, about 1,000 additional positive outcomes could occur. This translates to about four patients per entity and means that improving performance on this measure could help ensure that several hundred more patients are assessed for readiness, potentially leading to better health outcomes. For Component 2, the total estimated number of positive outcomes (eligible patients who received SBT) across all deciles is about 19,100. If the average performance of decile 8 (100%) is considered a plausible, achievable score, and the entities in deciles 1 through 7 improved to reach that rate, about 400 additional patients would receive SBT, which translates to less than two patients per entity. 

                                              Importance Criterion Definition

                                              The Meaningfulness criterion will be evaluated as part of the full Preliminary Assessment available in September. 

                                                Criterion Definition

                                                This criterion will be evaluated as part of the full Preliminary Assessment available in September. 

                                                  Criterion Definition

                                                  This criterion will be evaluated as part of the full Preliminary Assessment available in September. 

                                                  PA Type
                                                  Performance and Impact Analysis (PIA)

                                                  Influenza Vaccination Coverage among Healthcare Personnel

                                                  CMS Measures Inventory Tool (CMIT) ID
                                                  00390-01-C-LTCHQR
                                                  Steward Organization Group
                                                  Centers for Disease Control and Prevention
                                                  Committee
                                                  MSR Recommendation Group
                                                    Measure Overview
                                                      Use in CMS Programs
                                                      CMS Program History
                                                      • Finalized in the Long-Term Care Hospital Quality Reporting in 2012
                                                      • Implemented in the Long-Term Care Hospital Quality Reporting in 2015
                                                      • This measure also has active program-variants in Hospital Inpatient Quality Reporting, Skilled Nursing Facility Quality Reporting, Inpatient Rehabilitation Facility Quality Reporting, and Prospective Payment System-Exempt Cancer Hospital Quality Reporting
                                                      Description

                                                      Percentage of healthcare personnel (HCP) who receive the influenza vaccination.

                                                      Numerator

                                                      The numerator for this measure consists of HCP in the denominator population, who fall into one of the categories below. HCP should be counted as vaccinated if they receive influenza vaccine any time from when it first became available, such as August or September, through March 31 of the following year. 

                                                      • Received an influenza vaccination administered at the healthcare facility.
                                                      • Reported in writing (paper or electronic) or provided documentation that influenza vaccination was received elsewhere.
                                                      • Determined to have a medical contraindication/condition of severe allergic reaction to eggs or other component(s) of the vaccine, or history of Guillain-Barre Syndrome (GBS) within 6 weeks after a previous influenza vaccination.
                                                      • Offered but declined influenza vaccination.
                                                      • Had an unknown vaccination status or did not otherwise meet any of the definitions of the other numerator categories.
                                                      Numerator Exclusions

                                                      N/A

                                                      Numerator Exceptions

                                                      N/A

                                                      Denominator

                                                      The denominator for this measure consists of healthcare personnel (HCP) who are physically present in the healthcare facility for at least 1 working day between October 1 through March 31 of the following year. Denominators are to be calculated separately for three required categories of HCP and can also be calculated for a fourth optional category:

                                                      • Employees (required): This includes all persons receiving a direct paycheck from the reporting facility (i.e., on the facility's payroll), regardless of clinical responsibility or patient contact. 
                                                      • Licensed independent practitioners (LIPs) (required): This includes physicians (MD, DO), advanced practice nurses, and physician assistants who are affiliated with the reporting facility, but are not directly employed by it (i.e., they do not receive a paycheck from the facility), regardless of clinical responsibility or patient contact. Post-residency fellows are also included in this category if they are not on the facility's payroll.
                                                      • Adult students/trainees and volunteers (required): This includes medical, nursing, or other health professional students, interns, medical residents, or volunteers aged 18 or older who are affiliated with the healthcare facility, but are not directly employed by it (i.e., they do not receive a paycheck from the facility), regardless of clinical responsibility or patient contact.
                                                      • Other contract personnel (optional): Contract personnel are defined as persons providing care, treatment, or services at the facility through a contract who do not fall into any of the other denominator categories. Please note this also includes vendors providing care, treatment, or services at the facility who may or may not be paid through a contract. Reporting for this category is currently optional. 
                                                      Denominator Exclusions

                                                      None

                                                      Denominator Exceptions

                                                      N/A

                                                      Cascade of Meaningful Measures Priority
                                                      Measure Type
                                                      Process
                                                      Level of Analysis
                                                      Facility
                                                      Care Setting
                                                      Hospital: Inpatient Acute Care Facility
                                                      Hospital: Long-Term Care
                                                      Ambulatory Care: Clinician Office
                                                      Ambulatory Surgery Center
                                                      Behavioral Health: Inpatient (e.g., Inpatient Psychiatric Facility)
                                                      Dialysis Facility
                                                      Home Health
                                                      Hospital: Outpatient
                                                      Inpatient Rehabilitation Facility
                                                      Nursing Home/Skilled Nursing Facility
                                                      CBE Endorsement Status
                                                      Endorsed
                                                      CBE Endorsement History
                                                      • Initial endorsement in 2008 and retained endorsement during maintenance review in 2022

                                                      Link to Endorsement Measure Record: Influenza Vaccination Coverage Among Healthcare Personnel

                                                        About this Analysis (Measure Score by PY)

                                                        Impact Summary: This measure supports the Long‑Term Care Hospital (LTCH) Quality Reporting Program goal of measuring and improving the quality of care provided in long‑term care hospitals by assessing whether LTCHs implement a core patient‑safety and infection‑prevention practice, health care personnel influenza vaccination, to support safer care environments and improve the quality of care for patients with complex, prolonged hospital stays. 

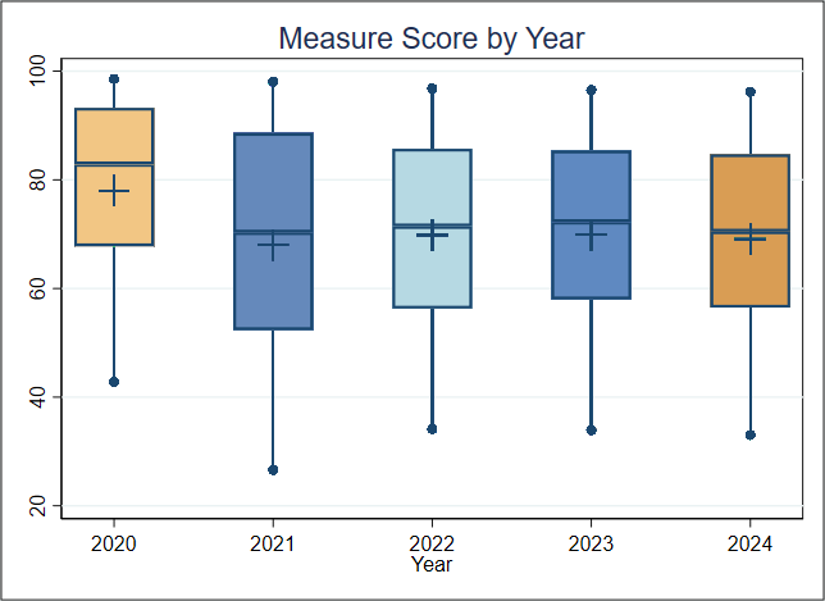
                                                        Facility performance decreased between 2020 and 2021, then had little discernable change from 2021 to 2024, showing an opportunity for improvement in vaccination of HCP. Improving performance among lower-scoring facilities could help ensure 17,500 additional HCP, or about 58 HCP per entity, receive influenza vaccinations.

                                                        For this measure, Battelle reviewed the following publicly available datasets available at Long-Term Care Hospital - Provider Data | Provider Data Catalog (cms.gov):

                                                        • long-term_care_hospitals_03_2026.zip (which contains data from April 2024-March 2025 and is referred to as year 2024 in this assessment)
                                                        • long-term_care_hospitals_03_2025.zip (which contains data from April 2023-March 2024 and is referred to as year 2023 in this assessment)
                                                        • long-term_care_hospitals_03_2024.zip (which contains data from April 2022-March 2023 and is referred to as year 2022 in this assessment)
                                                        • long-term_care_hospitals_03_2023.zip (which contains data from April 2021-March 2022 and is referred to as year 2021 in this assessment)
                                                        • long-term_care_hospitals_12_2022.zip (which contains data from October 2020-March 2021 and is referred to as year 2020 in this assessment)

                                                        Battelle analyzed all values for “L_015_01” not marked as “Not Available” from the corresponding Long-term_Care_Hospital-Provider_Data.csv file.


                                                        About Figure 1: Figure 1 is a boxplot that shows how scores have changed based on the most recent 5 years of data available. For each year, the boxplot displays a box with lines and dots to help visualize the range and distribution of scores. The dots represent the points where the lowest 5% and highest 5% of scores fall, and the line connecting them shows where 90% of the scores are located. The box itself covers the middle half of the scores, from the 25th to the 75th percentile. Inside the box, a horizontal line marks the median score, which is the middle value, while a “+” sign shows the average score. This type of graph makes overall trends in scores over time as well as the consistency and spread of the results easier to understand.
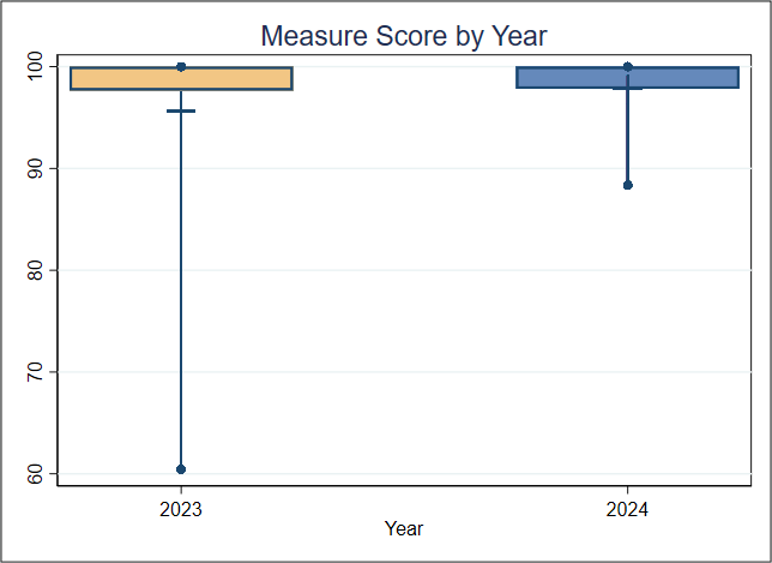
                                                        Figure 1 (Measure Score by PY)
                                                        boxplot

                                                        Figure 1. Boxplot of Measure Score by Year

                                                        Interpretation (Measure Score by PY)

                                                        Figure 1 Interpretation: Figure 1 shows a drop from a median value of nearly 83% in 2020 to a median value of 70.3% in 2021. There has been little discernible change since 2021. For this measure, a higher score indicates better quality of care.

                                                        About this Analysis (Score Distro)

                                                        About Table 1: Table 1 illustrates the distribution of scores and the population represented within each group. It is important to note that the groups (referred to as deciles, each comprising 10% of the organizations) with the lowest or highest scores may contain larger or smaller populations than other groups. For example, if the lowest-scoring decile includes only 5% of the total population, then smaller group size may be associated with lower performance scores.

                                                        Table 1 (Score Distro)

                                                        Table 1. Importance in the most recent year of data available (Decile by Measure Score, 2024) 

                                                         OverallDecile 1Decile 2Decile 3Decile 4Decile 5Decile 6Decile 7Decile 8Decile 9Decile 10
                                                        Average Score (Standard Deviation)

                                                        69.1 (19.5)

                                                        30.3

                                                        49.0

                                                        56.6

                                                        63.0

                                                        68.5

                                                        73.4

                                                        79.2

                                                        84.6

                                                        90.7

                                                        96.5

                                                        Entities

                                                        304

                                                        31

                                                        30

                                                        31

                                                        30

                                                        30

                                                        31

                                                        30

                                                        31

                                                        30

                                                        30

                                                        Population

                                                        100,241

                                                        10,029

                                                        9,606

                                                        11,159

                                                        10,642

                                                        8,631

                                                        11,951

                                                        8,950

                                                        7,587

                                                        8,052

                                                        13,634

                                                        Interpretation (Score Distro)

                                                        Table 1 Interpretation: To estimate the number of positive outcomes (influenza vaccinations for health care personnel), the population is multiplied by the average score for each decile. Right now, the total estimated number of positive outcomes across all deciles is about 70,000. If the average performance of Decile 8 (84.6%) is considered a plausible, achievable score, and the entities in Deciles 1 through 7 improved to reach that score, about 17,500 additional positive outcomes could occur. This translates to about 58 health care personnel per entity and means that improving performance on this measure could help ensure that several thousand more health care workers receive influenza vaccinations, potentially leading to better health outcomes.

                                                          Importance Criterion Definition

                                                          The Meaningfulness criterion will be evaluated as part of the full Preliminary Assessment available in September. 

                                                            Criterion Definition

                                                            This criterion will be evaluated as part of the full Preliminary Assessment available in September.  

                                                              Criterion Definition

                                                              This criterion will be evaluated as part of the full Preliminary Assessment available in September.  

                                                              PA Type
                                                              Performance and Impact Analysis (PIA)

                                                              Percent of Residents Experiencing One or More Falls with Major Injury (Long Stay)

                                                              This measure reports the percentage of long-stay residents in a nursing home who have experienced one or more falls resulting in major injury (defined as bone fractures, joint dislocations, closed head injuries with altered consciousness, or subdural hematoma) reported in the look-back period no more than 275 days prior to the target assessment. The long stay nursing home population is defined as residents who have received 101 or more cumulative days of nursing home care by the end of the target assessment period.

                                                              CBE ID
                                                              0674