Breadcrumb

  1. Home

Ambulatory Surgery Center

PRMR Measure Valid
On
Valid for Measure Submission

Appropriate Assessment of Retrievable Inferior Vena Cava (IVC) Filters for Removal

CMS Measures Inventory Tool (CMIT) ID
00068-01-C-MIPS
Steward Organization Group
Society of Interventional Radiology
Committee
MSR Recommendation Group
    Measure Overview
      Use in CMS Programs
      CMS Program History
      • Finalized through rulemaking for inclusion in the Merit-based Incentive Payment System (MIPS) in 2016. 
      • Implemented in MIPS starting with Performance Year (PY) 2017.
      Description

      Percentage of patients in whom a retrievable IVC filter is placed who, within 3 months post-placement, have a documented assessment for the appropriateness of continued filtration, device removal or the inability to contact the patient with at least two attempts.

      Numerator

      Number of patients that have appropriate IVC filter follow-up.

      Numerator Exclusions

      N/A

      Numerator Exceptions

      N/A

      Denominator

      All patients who have a retrievable IVC filter placed with the intent for potential removal at time of placement.

      Denominator Exclusions

      None

      Denominator Exceptions

      N/A

      Cascade of Meaningful Measures Priority
      Measure Type
      Process
      Level of Analysis
      Clinician: Group/Practice
      Clinician: Individual
      Care Setting
      Ambulatory Surgery Center
      Hospital: Outpatient
      CBE Endorsement Status
      Not Endorsed
      CBE Endorsement History

      N/A

        About this Analysis (Measure Score by PY)

        Impact Summary: This measure supports the Merit‑based Incentive Payment System (MIPS) by promoting appropriate follow‑up assessment for patients who receive retrievable inferior vena cava (IVC) filters, a process intended to support safe device management and timely removal when clinically appropriate. 

        Due to low reporting on this measure, no benchmark data are currently available in the publicly reported MIPS Quality Benchmarks files reviewed for this assessment. As a result, performance trends and the potential impact of improvement on patient outcomes cannot be evaluated at this time. The absence of benchmark data limits the ability to assess the importance or impact of this measure within MIPS. The measure is included in the Interventional Radiology MIPS Value Pathway (MVP), which may help increase adoption and reporting in the future.

        For this measure, Battelle reviewed the following publicly available datasets at Benchmarks - QPP:

        • 2026 MIPS Quality Benchmarks.csv 
        • 2025 MIPS Quality Benchmarks.csv 
        • 2024 MIPS Quality Benchmarks.csv 
        • 2023 MIPS Quality Benchmarks.csv

        There are no benchmark values for “Measure_ID”=421 in these files, and therefore no data are available to assess this measure. During these years, CMS did not receive sufficient data submissions to establish a performance period benchmark.

          Importance Criterion Definition

          The Meaningfulness criterion will be evaluated as part of the full Preliminary Assessment available in September.  

            Criterion Definition

            This criterion will be evaluated as part of the full Preliminary Assessment available in September. 

              Criterion Definition

              This criterion will be evaluated as part of the full Preliminary Assessment available in September. 

              CollaboRATE Shared Decision-Making Tool for Ambulatory or Outpatient Surgery Patients (Surgical CollaboRATE OAS-PM)

              This measure assesses facility level compliance with administration of the CollaboRATE Shared Decision-Making tool to patients undergoing outpatient or ambulatory surgery. To be compliant, facilities must offer 95% of patients the option to complete the CollaboRATE survey within 1 week of the shared decision making conversation.


              CollaboRATE has been administered as a paper handout, via mail, electronic mail, computer or web interface, voice recorded telephone interviews, SMS text messages, and through MyChart EHR integration.

              Facility 7-Day Risk-Standardized Hospital Visit Rate after Outpatient Colonoscopy

              This measure was developed to improve the quality of care delivered to patients undergoing outpatient colonoscopy procedures. The Facility 7-Day Risk-Standardized Hospital Visit Rate after Outpatient Colonoscopy Measure, estimates a facility-level rate of risk-standardized, all-cause, unplanned hospital visits within seven days of a colonoscopy procedure performed at a hospital outpatient department (HOPD) or ambulatory surgical center (ASC) among Medicare Fee-for-Service (FFS) patients aged 65 years and older.

              CBE ID
              2539

              Facility-Level 7-Day Hospital Visits after General Surgery Procedures Performed at Ambulatory Surgical Centers

              This measure was developed to improve the quality of care delivered to patients undergoing general surgery procedures in an ambulatory surgical center (ASC). To assess quality, the measure calculates the risk-standardized rate of return to a hospital for an acute, unplanned hospital visit within seven days of qualified general surgery procedures performed at an ambulatory surgical center (ASC) among Medicare Fee-For-Service (FFS) patients aged 65 years and older.

              CBE ID
              3357

              Hospital Visits After Hospital Outpatient Surgery

              CMS Measures Inventory Tool (CMIT) ID
              00344-01-C-HOQR
              Steward Organization Group
              Centers for Medicare & Medicaid Services (CMS)
              Committee
              MSR Recommendation Group
                Measure Overview
                  Use in CMS Programs
                  CMS Program History
                  • Measure finalized in rulemaking for use in Hospital Outpatient Quality Reporting Program in the CY 2015 OPPS/ASC final rule. 
                  • Measure has been active in the Hospital Outpatient Quality Reporting Program since 2016. 
                  Description

                  The facility-level, post-surgical risk-standardized hospital visit ratio (RSHVR) of the predicted to expected number of all-cause, unplanned hospital visits within 7 days of a same-day surgery at a hospital outpatient department among Medicare Fee-for-Service (FFS) patients aged 65 years and older.

                  Numerator

                  The surgery measure outcome is all-cause unplanned hospital visits, defined as 1) an inpatient admission directly following surgery or 2) an emergency department (ED) visit, observation stay, or unplanned inpatient admission occurring after discharge from the HOPD and within 7 days of the outpatient surgery.

                  Numerator Exclusions

                  N/A

                  Numerator Exceptions

                  N/A

                  Denominator

                  Eligible same-day surgeries or cystoscopy procedures with intervention performed at HOPDs for Medicare FFS patients aged 65 years and older, with the exception of eye surgeries and same-day surgeries performed concurrently with high-risk procedures.

                  Denominator Exclusions

                  The measure excludes: 

                  • Procedures for patients who lack continuous enrollment in Medicare FFS Parts A and B in the 7 days after the surgery. 
                  • Surgeries that occur on the same day and at the same hospital as an ED visit that is billed on a different claim than the index surgery, unless the ED visit has a diagnosis indicative of a complication of care.
                  • Surgeries that are billed on the same hospital claim as an ED visit and that occur on the same calendar day unless the ED visit has a diagnosis indicative of a complication of care.
                  • Surgeries that are billed on the same hospital outpatient claim and that occur after the ED visit.
                  • Surgeries that are billed on the same outpatient claim as an observation stay.
                  Denominator Exceptions

                  N/A

                  Cascade of Meaningful Measures Priority
                  Measure Type
                  Outcome
                  Level of Analysis
                  Facility
                  Care Setting
                  Hospital: Inpatient Acute Care Facility
                  Ambulatory Surgery Center
                  Hospital: Outpatient
                  CBE Endorsement Status
                  Endorsed
                  CBE Endorsement History
                  • Initially endorsed in 2015.
                  • Maintenance review retained endorsement in 2023.

                  Link to Endorsement Measure Record: Hospital Visits after Hospital Outpatient Surgery

                    About this Analysis (Measure Score by PY)

                    Impact Summary: This measure supports the Hospital Outpatient Quality Reporting Program’s goal of improving outpatient care quality and patient experience in hospital settings by monitoring the post-surgical risk-standardized hospital visit ratio within 7 days of a same-day surgery at a hospital outpatient department. 

                    Performance varied from 2020 to 2024, with the widest range of measure scores for hospital outpatient departments (HOPDs) occurring in 2023. As shown in Table 1, the highest-performing 10% of the entities (Decile 1) contains 21% of the total patients, indicating that larger entities tend to perform better.

                    For this measure, Battelle reviewed the following publicly available datasets available at Hospitals data archive | Provider Data Catalog:

                    • hospitals_02_2026.zip (which contains data from 2024)
                    • hospitals_11_2025.zip (which contains data from 2023)
                    • hospitals_10_2024.zip (which contains data from 2022)
                    • hospitals_11_2023.zip (which contains data from 2021)
                    • hospitals_10_2022.zip (which contains data from 2020)

                    Battelle analyzed all values for “Measure_ID”=”OP_36” not marked as “Not Available” from the corresponding Unplanned_Hospital_Visits-Hospital.csv file.


                    About Figure 1: Figure 1 is a boxplot that shows how scores have changed based on the most recent 5 years of data available. For each year, the boxplot displays a box with lines and dots to help visualize the range and distribution of scores. The dots represent the points where the lowest 5% and highest 5% of scores fall, and the line connecting them shows where 90% of the scores are located. The box itself covers the middle half of the scores, from the 25th to the 75th percentile. Inside the box, a horizontal line marks the median score, which is the middle value, while a “+” sign shows the average score. This type of graph makes overall trends in scores over time as well as the consistency and spread of the results easier to understand.
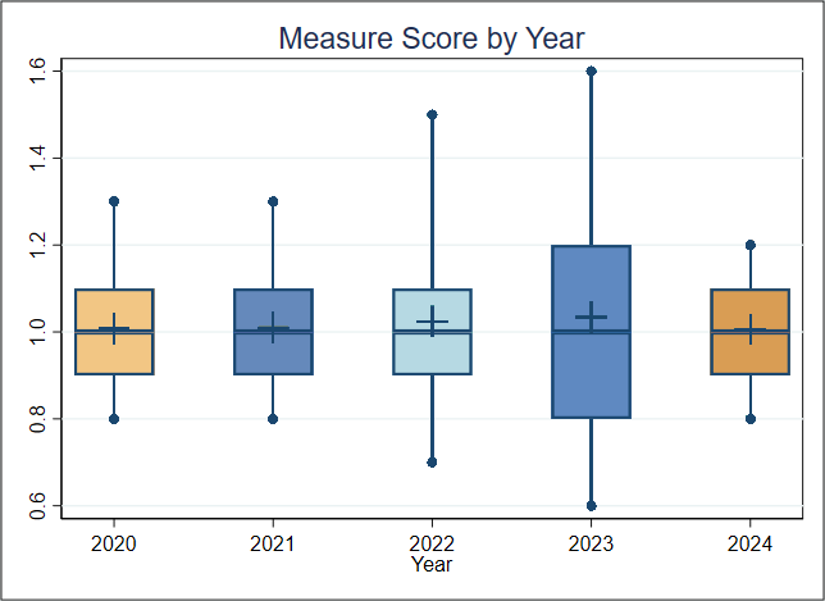
                    Figure 1 (Measure Score by PY)
                    boxplot

                    Figure 1. Boxplot of Measure Score by Year

                    Interpretation (Measure Score by PY)

                    Figure 1 Interpretation: Because this measure is a ratio of an entity’s risk-adjusted rate to the national rate for the same year, Figure 1 is not very informative for assessing change over time. The median ratio is always 1.0. Slight variation in spread year-over-year suggests gap between best and worst performers shifted modestly over time, but no clear trend can be drawn from this alone. For this measure, a lower score indicates better quality of care.

                    About this Analysis (Score Distro)

                    About Table 1: Table 1 illustrates the distribution of scores and the population represented within each group, for the most recent year with data available. It is important to note that the groups (referred to as deciles, each comprising 10% of the organizations) with the lowest or highest scores may contain larger or smaller populations than other groups. For example, if the lowest-scoring decile includes only 5% of the total population, then smaller group size may be associated with lower performance scores.

                    Table 1 (Score Distro)

                    Table 1. Importance in the most recent year of data available (Decile by Measure Score, 2024) 

                     OverallDecile 1Decile 2Decile 3Decile 4Decile 5Decile 6Decile 7Decile 8Decile 9Decile 10
                    Average Score (Standard Deviation)

                    1.010 (0.128)

                    0.801

                    0.900

                    0.900

                    0.978

                    1.000

                    1.000

                    1.013

                    1.100

                    1.114

                    1.252

                    Entities

                    2,725

                    273

                    272

                    273

                    272

                    273

                    272

                    273

                    272

                    273

                    272

                    Population

                    1,228,348

                    259,203

                    137,172

                    138,342

                    96,259

                    89,338

                    93,799

                    103,467

                    108,595

                    94,959

                    107,214

                    Interpretation (Score Distro)

                    Table 1 Interpretation: The highest-performing 10% of the entities (Decile 1) contains 259,203 patients, 21% of the 1,228,348 total patients, indicating that larger entities tend to perform better.  Based on the information available in the datasets utilized, Battelle could not calculate an estimate of what plausible improvement on this measure might look like across entities. Additional analyses beyond the scope of this impact assessment may be warranted to directly evaluate the association between population size and measure score and to identify the institutional factors that contribute to stronger performance on this measure.

                      Importance Criterion Definition

                      The Meaningfulness criterion will be evaluated as part of the full Preliminary Assessment available in September. 

                        Criterion Definition

                        This criterion will be evaluated as part of the full Preliminary Assessment available in September.  

                          Criterion Definition

                          This criterion will be evaluated as part of the full Preliminary Assessment available in September.  

                          PA Type
                          Performance and Impact Analysis (PIA)

                          Hospital Visits after Orthopedic Ambulatory Surgical Center Procedures

                          This measure was developed to improve the quality of care delivered to patients undergoing orthopedic procedures in an ambulatory surgical center (ASC). To assess quality, the measure calculates the risk-standardized rate of acute, unplanned hospital visits within seven days of qualified orthopedic surgeries or procedures performed at an ASC among Medicare fee-for-service (FFS) patients aged 65 years and older. An unplanned hospital visit is defined as an emergency department (ED) visit, observation stay, or unplanned inpatient admission.

                          CBE ID
                          3470

                          Hospital Visits After Urology Ambulatory Surgical Center Procedures

                          This measure was developed to improve the quality of care delivered to patients undergoing urology procedures in an ambulatory surgical center (ASC). The measure estimates a facility-level rate of risk-standardized, all-cause, unplanned hospital visits within seven days of a urology surgery at an ASC among Medicare fee-for-service (FFS) patients aged 65 years and older. An unplanned hospital visit is defined as an emergency department (ED) visit, observation stay, or unplanned inpatient admission. 

                          CBE ID
                          3366

                          Influenza Vaccination Coverage among Healthcare Personnel

                          CMS Measures Inventory Tool (CMIT) ID
                          00390-01-C-PCHQR
                          Steward Organization Group
                          Centers for Disease Control and Prevention
                          Committee
                          MSR Recommendation Group
                            Measure Overview
                              Use in CMS Programs
                              CMS Program History
                              • Finalized in the Prospective Payment System-Exempt Cancer Hospital Quality Reporting in 2012
                              • Implemented in the Prospective Payment System-Exempt Cancer Hospital Quality Reporting in 2015
                              • This measure also has active program-variants in Hospital Inpatient Quality Reporting, Long-Term Care Hospital Quality Reporting, Skilled Nursing Facility Quality Reporting, and Inpatient Rehabilitation Facility Quality Reporting
                              Description

                              The Influenza HCP measure assesses the percentage of HCP who receive the influenza vaccination. The measure is designed to ensure that reported HCP influenza vaccination percentages are consistent over time within a single healthcare facility and comparable across facilities.

                              Numerator

                              The numerator for this measure consists of HCP in the denominator population, who fall into one of the categories below. HCP should be counted as vaccinated if they receive influenza vaccine any time from when it first became available, such as August or September, through March 31 of the following year.   

                              • Received an influenza vaccination administered at the healthcare facility. 
                              • Reported in writing (paper or electronic) or provided documentation that influenza vaccination was received elsewhere. 
                              • Determined to have a medical contraindication/condition of severe allergic reaction to eggs or other component(s) of the vaccine, or history of Guillain-Barre Syndrome (GBS) within 6 weeks after a previous influenza vaccination. 
                              • Offered but declined influenza vaccination. 
                              • Had an unknown vaccination status or did not otherwise meet any of the definitions of the other numerator categories. 
                              Numerator Exclusions

                              N/A

                              Numerator Exceptions

                              N/A

                              Denominator

                              The denominator for this measure consists of healthcare personnel (HCP) who are physically present in the healthcare facility for at least 1 working day between October 1 through March 31 of the following year. Denominators are to be calculated separately for three required categories of HCP and can also be calculated for a fourth optional category: 

                              • Employees (required): This includes all persons receiving a direct paycheck from the reporting facility (i.e., on the facility's payroll), regardless of clinical responsibility or patient contact.  
                              • Licensed independent practitioners (LIPs) (required): This includes physicians (MD, DO), advanced practice nurses, and physician assistants who are affiliated with the reporting facility, but are not directly employed by it (i.e., they do not receive a paycheck from the facility), regardless of clinical responsibility or patient contact. Post-residency fellows are also included in this category if they are not on the facility's payroll. 
                              • Adult students/trainees and volunteers (required): This includes medical, nursing, or other health professional students, interns, medical residents, or volunteers aged 18 or older who are affiliated with the healthcare facility, but are not directly employed by it (i.e., they do not receive a paycheck from the facility), regardless of clinical responsibility or patient contact. 
                              • Other contract personnel (optional): Contract personnel are defined as persons providing care, treatment, or services at the facility through a contract who do not fall into any of the other denominator categories. Please note this also includes vendors providing care, treatment, or services at the facility who may or may not be paid through a contract. Reporting for this category is currently optional.  
                              Denominator Exclusions

                              None

                              Denominator Exceptions

                              N/A

                              Cascade of Meaningful Measures Priority
                              Measure Type
                              Process
                              Level of Analysis
                              Facility
                              Care Setting
                              Hospital: Inpatient Acute Care Facility
                              Hospital: Long-Term Care
                              Ambulatory Care: Clinician Office
                              Ambulatory Surgery Center
                              Dialysis Facility
                              Hospital: Outpatient
                              Inpatient Rehabilitation Facility
                              Nursing Home/Skilled Nursing Facility
                              CBE Endorsement Status
                              Endorsed
                              CBE Endorsement History
                              • Initial endorsement in 2008 and retained endorsement during maintenance review in 2022

                              Link to Endorsement Measure Record: Influenza Vaccination Coverage Among Healthcare Personnel

                                About this Analysis (Measure Score by PY)

                                Impact Summary: This measure supports the PPS‑Exempt Cancer Hospital Quality Reporting Program goal of equipping consumers with quality‑of‑care information and encouraging hospitals and clinicians to improve the quality of inpatient care for Medicare beneficiaries by assessing whether PPS‑exempt cancer hospitals report and adhere to a recognized best‑practice patient‑safety measure, health care personnel influenza vaccination, thereby promoting safer care environments and transparency in cancer inpatient care. 

                                The small number of PCHQR hospitals eligible to report on this measure, rather than low participation among a large eligible group, affects analysis of measure performance over the past 5 years.

                                With a low number of facilities for the years 2020 to 2024, any changes in performance on this measure may be attributed to random error as opposed to any apparent trend in HCP influenza vaccination. The measure identified 100,000 influenza vaccinations among HCP. Improving performance among lower-scoring facilities could help ensure 15,000 additional HCP, or about 1,400 HCP per entity, receive influenza vaccinations.

                                For this measure, Battelle reviewed the following publicly available datasets available at  Hospitals data archive | Provider Data Catalog:

                                • Hospitals_02_2026.zip (which contains data from October 2024-March 2025 and is referred to as year 2024 in this assessment)
                                • Hospitals_02_2025.zip (which contains data from October 2023-March 2024 and is referred to as year 2023 in this assessment)
                                • Hospitals_01_2024.zip (which contains data from October 2022-March 2023 and is referred to as year 2022 in this assessment)
                                • Hospitals_01_2023.zip (which contains data from October 2021-March 2022 and is referred to as year 2021 in this assessment)
                                • Hospitals_01_2022.zip (which contains data from October 2020-March 2021 and is referred to as year 2020 in this assessment)

                                Battelle analyzed all values for “PCH_28” not marked as “Not Available” from the corresponding PCH_HEALTHCARE_ASSOCIATED_INFECTIONS_HOSPITAL.csv file.


                                About Figure 1: Figure 1 is a boxplot that shows how scores have changed based on the most recent 5 years of data available. For each year, the boxplot displays a box with lines and dots to help visualize the range and distribution of scores. The dots represent the points where the lowest 5% and highest 5% of scores fall, and the line connecting them shows where 90% of the scores are located. The box itself covers the middle half of the scores, from the 25th to the 75th percentile. Inside the box, a horizontal line marks the median score, which is the middle value, while a “+” sign shows the average score. This type of graph makes overall trends in scores over time as well as the consistency and spread of the results easier to understand.
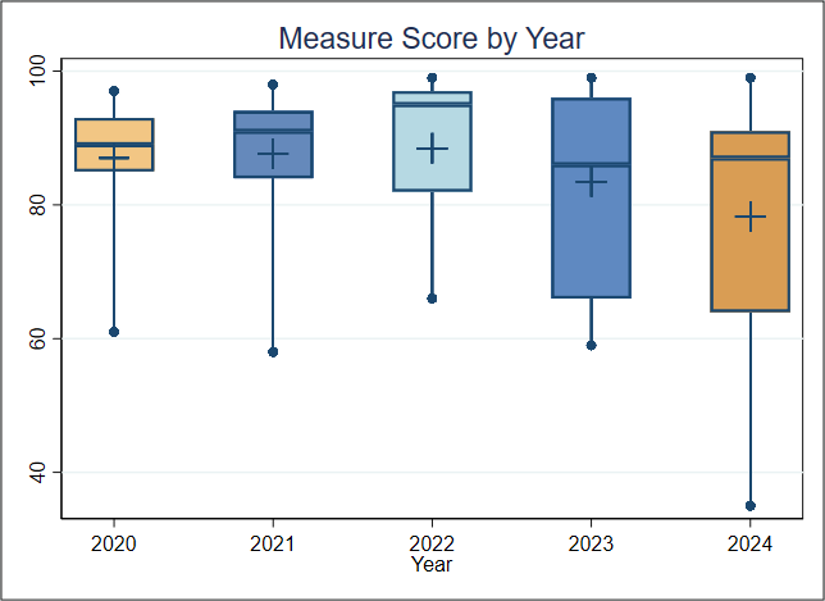
                                Figure 1 (Measure Score by PY)
                                boxplot

                                Figure 1. Boxplot of Measure Score by Year

                                Interpretation (Measure Score by PY)

                                Figure 1 Interpretation: There are only 10-11 entities per year, so any apparent trend may just as likely be attributed to random error, indicating little discernible change across the 5 years. Overall, the limited number of PPS-exempt cancer hospitals participating and reporting in this program makes it difficult to analyze overall performance trends. For this measure, a higher score indicates better quality of care.

                                About this Analysis (Score Distro)

                                About Table 1: Table 1 illustrates the distribution of scores and the population represented within each group in the most recent year with data available. It is important to note that the groups (referred to as deciles, each comprising 10% of the organizations) with the lowest or highest scores may contain larger or smaller populations than other groups. For example, if the lowest-scoring decile includes only 5% of the total population, then smaller entity size may be associated with lower performance scores.

                                Table 1 (Score Distro)

                                Table 1. Importance in the Most Recent Year of Data Available (Decile by Measure Score, 2024) 

                                 OverallDecile 1Decile 2Decile 3Decile 4Decile 5Decile 6Decile 7Decile 8Decile 9Decile 10
                                Average Score (Standard Deviation)

                                78.3 (20.0)

                                45.0

                                64.0

                                71.0

                                83.0

                                87.0

                                88.0

                                89.0

                                91.0

                                99.0

                                99.0

                                Entities

                                11

                                2

                                1

                                1

                                1

                                1

                                1

                                1

                                1

                                1

                                1

                                Population

                                128,459

                                16,533

                                15,007

                                4,436

                                27,692

                                2,689

                                3,106

                                18,574

                                7,143

                                10,388

                                22,891

                                Interpretation (Score Distro)

                                Table 1 Interpretation: To estimate the number of positive outcomes (influenza vaccinations for health care personnel), the population is multiplied by the average score for each decile. Right now, the total estimated number of positive outcomes across all deciles is about 100,000. If the average performance of Decile 8 (91.0%) is considered a plausible, achievable score, and the entities in Deciles 1 through 7 improved to reach that score, about 15,000 additional positive outcomes could occur. This translates to about 1,400 health care personnel per entity and means that improving performance on this measure could help ensure that several thousand more health care workers receive influenza vaccinations, potentially leading to better health outcomes.

                                  Importance Criterion Definition

                                  The Meaningfulness criterion will be evaluated as part of the full Preliminary Assessment available in September. 

                                    Criterion Definition

                                    This criterion will be evaluated as part of the full Preliminary Assessment available in September.  

                                      Criterion Definition

                                      This criterion will be evaluated as part of the full Preliminary Assessment available in September.  

                                      PA Type
                                      Performance and Impact Analysis (PIA)

                                      Influenza Vaccination Coverage among Healthcare Personnel

                                      CMS Measures Inventory Tool (CMIT) ID
                                      00390-01-C-LTCHQR
                                      Steward Organization Group
                                      Centers for Disease Control and Prevention
                                      Committee
                                      MSR Recommendation Group
                                        Measure Overview
                                          Use in CMS Programs
                                          CMS Program History
                                          • Finalized in the Long-Term Care Hospital Quality Reporting in 2012
                                          • Implemented in the Long-Term Care Hospital Quality Reporting in 2015
                                          • This measure also has active program-variants in Hospital Inpatient Quality Reporting, Skilled Nursing Facility Quality Reporting, Inpatient Rehabilitation Facility Quality Reporting, and Prospective Payment System-Exempt Cancer Hospital Quality Reporting
                                          Description

                                          Percentage of healthcare personnel (HCP) who receive the influenza vaccination.

                                          Numerator

                                          The numerator for this measure consists of HCP in the denominator population, who fall into one of the categories below. HCP should be counted as vaccinated if they receive influenza vaccine any time from when it first became available, such as August or September, through March 31 of the following year. 

                                          • Received an influenza vaccination administered at the healthcare facility.
                                          • Reported in writing (paper or electronic) or provided documentation that influenza vaccination was received elsewhere.
                                          • Determined to have a medical contraindication/condition of severe allergic reaction to eggs or other component(s) of the vaccine, or history of Guillain-Barre Syndrome (GBS) within 6 weeks after a previous influenza vaccination.
                                          • Offered but declined influenza vaccination.
                                          • Had an unknown vaccination status or did not otherwise meet any of the definitions of the other numerator categories.
                                          Numerator Exclusions

                                          N/A

                                          Numerator Exceptions

                                          N/A

                                          Denominator

                                          The denominator for this measure consists of healthcare personnel (HCP) who are physically present in the healthcare facility for at least 1 working day between October 1 through March 31 of the following year. Denominators are to be calculated separately for three required categories of HCP and can also be calculated for a fourth optional category:

                                          • Employees (required): This includes all persons receiving a direct paycheck from the reporting facility (i.e., on the facility's payroll), regardless of clinical responsibility or patient contact. 
                                          • Licensed independent practitioners (LIPs) (required): This includes physicians (MD, DO), advanced practice nurses, and physician assistants who are affiliated with the reporting facility, but are not directly employed by it (i.e., they do not receive a paycheck from the facility), regardless of clinical responsibility or patient contact. Post-residency fellows are also included in this category if they are not on the facility's payroll.
                                          • Adult students/trainees and volunteers (required): This includes medical, nursing, or other health professional students, interns, medical residents, or volunteers aged 18 or older who are affiliated with the healthcare facility, but are not directly employed by it (i.e., they do not receive a paycheck from the facility), regardless of clinical responsibility or patient contact.
                                          • Other contract personnel (optional): Contract personnel are defined as persons providing care, treatment, or services at the facility through a contract who do not fall into any of the other denominator categories. Please note this also includes vendors providing care, treatment, or services at the facility who may or may not be paid through a contract. Reporting for this category is currently optional. 
                                          Denominator Exclusions

                                          None

                                          Denominator Exceptions

                                          N/A

                                          Cascade of Meaningful Measures Priority
                                          Measure Type
                                          Process
                                          Level of Analysis
                                          Facility
                                          Care Setting
                                          Hospital: Inpatient Acute Care Facility
                                          Hospital: Long-Term Care
                                          Ambulatory Care: Clinician Office
                                          Ambulatory Surgery Center
                                          Behavioral Health: Inpatient (e.g., Inpatient Psychiatric Facility)
                                          Dialysis Facility
                                          Home Health
                                          Hospital: Outpatient
                                          Inpatient Rehabilitation Facility
                                          Nursing Home/Skilled Nursing Facility
                                          CBE Endorsement Status
                                          Endorsed
                                          CBE Endorsement History
                                          • Initial endorsement in 2008 and retained endorsement during maintenance review in 2022

                                          Link to Endorsement Measure Record: Influenza Vaccination Coverage Among Healthcare Personnel

                                            About this Analysis (Measure Score by PY)

                                            Impact Summary: This measure supports the Long‑Term Care Hospital (LTCH) Quality Reporting Program goal of measuring and improving the quality of care provided in long‑term care hospitals by assessing whether LTCHs implement a core patient‑safety and infection‑prevention practice, health care personnel influenza vaccination, to support safer care environments and improve the quality of care for patients with complex, prolonged hospital stays. 

                                            Facility performance decreased between 2020 and 2021, then had little discernable change from 2021 to 2024, showing an opportunity for improvement in vaccination of HCP. Improving performance among lower-scoring facilities could help ensure 17,500 additional HCP, or about 58 HCP per entity, receive influenza vaccinations.

                                            For this measure, Battelle reviewed the following publicly available datasets available at Long-Term Care Hospital - Provider Data | Provider Data Catalog (cms.gov):

                                            • long-term_care_hospitals_03_2026.zip (which contains data from April 2024-March 2025 and is referred to as year 2024 in this assessment)
                                            • long-term_care_hospitals_03_2025.zip (which contains data from April 2023-March 2024 and is referred to as year 2023 in this assessment)
                                            • long-term_care_hospitals_03_2024.zip (which contains data from April 2022-March 2023 and is referred to as year 2022 in this assessment)
                                            • long-term_care_hospitals_03_2023.zip (which contains data from April 2021-March 2022 and is referred to as year 2021 in this assessment)
                                            • long-term_care_hospitals_12_2022.zip (which contains data from October 2020-March 2021 and is referred to as year 2020 in this assessment)

                                            Battelle analyzed all values for “L_015_01” not marked as “Not Available” from the corresponding Long-term_Care_Hospital-Provider_Data.csv file.


                                            About Figure 1: Figure 1 is a boxplot that shows how scores have changed based on the most recent 5 years of data available. For each year, the boxplot displays a box with lines and dots to help visualize the range and distribution of scores. The dots represent the points where the lowest 5% and highest 5% of scores fall, and the line connecting them shows where 90% of the scores are located. The box itself covers the middle half of the scores, from the 25th to the 75th percentile. Inside the box, a horizontal line marks the median score, which is the middle value, while a “+” sign shows the average score. This type of graph makes overall trends in scores over time as well as the consistency and spread of the results easier to understand.
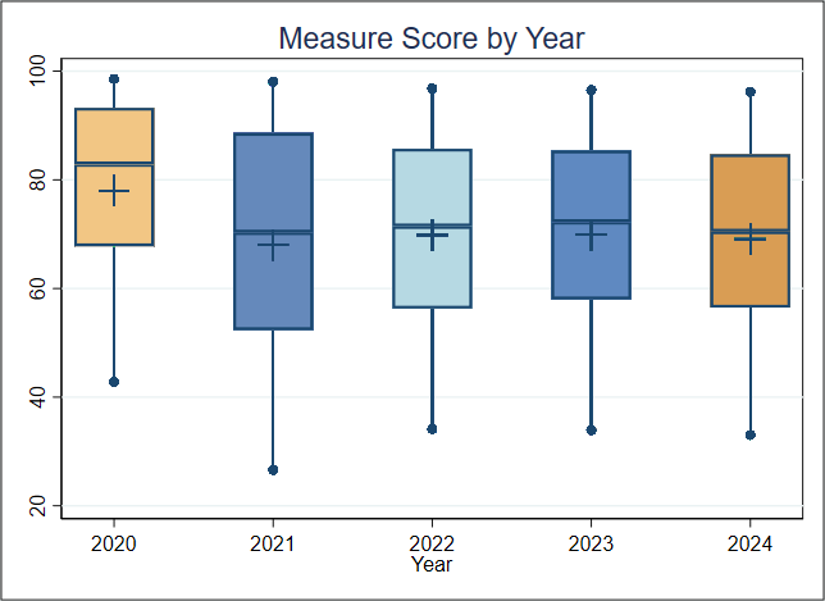
                                            Figure 1 (Measure Score by PY)
                                            boxplot

                                            Figure 1. Boxplot of Measure Score by Year

                                            Interpretation (Measure Score by PY)

                                            Figure 1 Interpretation: Figure 1 shows a drop from a median value of nearly 83% in 2020 to a median value of 70.3% in 2021. There has been little discernible change since 2021. For this measure, a higher score indicates better quality of care.

                                            About this Analysis (Score Distro)

                                            About Table 1: Table 1 illustrates the distribution of scores and the population represented within each group. It is important to note that the groups (referred to as deciles, each comprising 10% of the organizations) with the lowest or highest scores may contain larger or smaller populations than other groups. For example, if the lowest-scoring decile includes only 5% of the total population, then smaller group size may be associated with lower performance scores.

                                            Table 1 (Score Distro)

                                            Table 1. Importance in the most recent year of data available (Decile by Measure Score, 2024) 

                                             OverallDecile 1Decile 2Decile 3Decile 4Decile 5Decile 6Decile 7Decile 8Decile 9Decile 10
                                            Average Score (Standard Deviation)

                                            69.1 (19.5)

                                            30.3

                                            49.0

                                            56.6

                                            63.0

                                            68.5

                                            73.4

                                            79.2

                                            84.6

                                            90.7

                                            96.5

                                            Entities

                                            304

                                            31

                                            30

                                            31

                                            30

                                            30

                                            31

                                            30

                                            31

                                            30

                                            30

                                            Population

                                            100,241

                                            10,029

                                            9,606

                                            11,159

                                            10,642

                                            8,631

                                            11,951

                                            8,950

                                            7,587

                                            8,052

                                            13,634

                                            Interpretation (Score Distro)

                                            Table 1 Interpretation: To estimate the number of positive outcomes (influenza vaccinations for health care personnel), the population is multiplied by the average score for each decile. Right now, the total estimated number of positive outcomes across all deciles is about 70,000. If the average performance of Decile 8 (84.6%) is considered a plausible, achievable score, and the entities in Deciles 1 through 7 improved to reach that score, about 17,500 additional positive outcomes could occur. This translates to about 58 health care personnel per entity and means that improving performance on this measure could help ensure that several thousand more health care workers receive influenza vaccinations, potentially leading to better health outcomes.

                                              Importance Criterion Definition

                                              The Meaningfulness criterion will be evaluated as part of the full Preliminary Assessment available in September. 

                                                Criterion Definition

                                                This criterion will be evaluated as part of the full Preliminary Assessment available in September.  

                                                  Criterion Definition

                                                  This criterion will be evaluated as part of the full Preliminary Assessment available in September.  

                                                  PA Type
                                                  Performance and Impact Analysis (PIA)