Not endorsed due to no consensus.
This outcome measure assesses an individual's level of social inclusion and to what degree they are connected to others in their community. The target population for this measure is adults with disabilities who receive HCBS or HCBS-like services. This is a self-contained measure that can be administered independently of other RTCOM measures.
The measure is administered through an in-person or video-conferencing interview where an interviewer guides an individual through a series of questions (i.e., items) on the measure. There are 14 items on this measure:
G1. You feel you are part of your community.
G2. You feel lonely.
G3. You would like more support to keep in contact with people who are important to you.
S1. People in your community are friendly to you.
S2. You have people to go to when you need information about something.
S3. You have people to go to when you need a favor. (Examples: need to borrow $10, a ride to the doctor, take care of a pet)
S4. You have people in your life who help you feel better.
S5. You have people you can talk to.
S6. You spend time with friends when you want to.
S7. You have as many close friends who are not your family members or staff as you want.
S8. Your friends come to you when they need help.
S9. You keep in contact with your family members as much as you want to.
S10. You have the help you need to meet with people who are important to you.
S11. You have the help you need to meet people you might want to be friends with.
All items, with one exception, are scored 0 to 3 on a frequency scale with response options:
“Never/Rarely”
“Sometimes”
“Often”
“Almost Always/Always”
Item “S7” is scored 0 to 1 on a binary “No”/“Yes” scale.
Measure Specs
General Information
Social connectedness is a critically important IDM to measure in relation to HCBS outcomes as social isolation and loneliness are common results of poorly managed support and care systems for individuals with disabilities (Emerson et al, 2021; Macdonald, et al 2018). A lack of social connectedness and social isolation have been associated with physical as well as mental health outcomes and reduce the quality of life for people with IDD, TBI, physical, psychiatric, and age-related disabilities needs (Freeman et al, 2020; Martins et al, 2020; Silva, et al 2021). Although some differences exist with respect to outcomes in this area, regardless of whether one lives in a busy urban city or a rural environment Repke & Ipsen, 2020) or experiences a mild versus a severe disability (Freeman , et al, 2020; Pagan, 2022), members of these populations are at high risk for social isolation and loneliness.
Social connectedness is an important indicator as to whether the service system has merely moved individuals into community-based settings or is facilitating a fully inclusive community-based lifestyle. As Smull and Sanderson (2009), and others have stated, it tells us whether people with disabilities are merely living in the community or are of the community. Social connectedness has important direct as well as indirect implications for the quality-of-life experienced by persons with disabilities and is associated with a wide variety of other important outcomes. Individuals who are socially connected are more likely to have a rich informal support network to rely on improving the outcomes they experience in a wide variety of other areas including, community participation Amado, et al 2013), employment (Emerson et al, 2021; Park, et al, 2020), physical and mental health and wellness (Haslam et al, 2015; Holt-Lunstad, 2022; Litwin & Levinsky, 2022; Wickramaratne, et al., 2022), aging (Choi, et al 2020; Czaja et al 2021), and life span (Crowe , et al., 2021).
Social connectedness is a complex construct, especially when one attempts to apply it to persons with a wide variety of abilities and challenges that range from mild to severe. It is simplistic to think of this aspect of inclusion and its measurement as being based solely on counts of the number of social relationships/friendships one has or the number of times per week a person interacts with these individuals. It encompasses far more than that and is key to persons with disabilities being viewed by society as fully engaged members of their communities. Social connectedness, thereby, has value for persons with disabilities as both an outcome and a process. It is about ensuring that persons with disabilities have opportunities to actively participate as valued, respected and contributing individuals.
There are a number of dimensions of social connectedness (Donnelly & Coakley, 2002) that need to be addressed if one is to create a measure that truly reflects the construct. These include (a) valued recognition as significant others in persons’ lives, (b) accepting persons for who they are with all their gifts and challenges, (c) access to inclusive environments where one can initiate relationships with others, (d) having access to the supports necessary to become involved in the community activities participation in which support the building and maintenance of social relationships, and (e) having valued social roles not only being seen as someone who needs social support but as a resource that can provide it to others.
Conceptualized as it is in the current research, social connectedness must therefore be considered a latent construct (i.e., a theoretical, unobservable concept that one cannot directly observe or measure but must infer based upon assessment of a variety of observable indicators that theoretically or empirically are assumed to represent it). A general consensus among researchers in the field is that the goal of community inclusion entails expanding the social connectedness of people with disabilities so that they experience themselves as being part of a community and can both develop and maintain a network of friends (Clement & Bigby, 2009; Cobigo et al., 2012; Forrester-Jones et al., 2006). This requires a different approach than is often used in healthcare measurement and the use of composite scores.
Current research indicates that (a) a large percentage of people with disabilities are lonely and have social networks that do not meet their affiliation needs due the their small size, the persons who populate them, or a lack of access to those individuals with whom they most desire to socially interact (Choi et al, 2020; Lippold & Burns 2009; Forrester‐Jones et al. 2006), (b) although persons with disabilities have a relatively high frequency of contact with members of their social networks, a large percentage of network members tend to be paid professionals, (c) for large numbers of individuals with disabilities, sources of social-emotional, instrumental, informational and companionship support are typically limited to family and HCBS staff and are rarely reciprocal (Emerson et al, 2021; Verdugo et al, 2020; Saltzman, et al, 2020; Van Asselt-Goverts, et al., 2015), (d) low levels of emotional connectedness are often reported (Harrison , et al., 2021; Kelly , et al., 2017; Simplican, et al 2015); and (e) a sense of belonging - an essential element of social connectedness – is often missing in people’s lives (Bigby, 2008; Gur, et al., 2023; Stancliffe, et al, 2023).
The rationale for inclusion of a social connectedness IDM in our submitted measures was based on:
- A systematic review of the research in this area
- Use of a variety of processes, including the conduction of fifty-eight participatory planning and decision-making (PPDM) groups at a national level, to determine the extent to which stakeholders believed performance scores based on various components of the construct were important to include in measures under development,
- Input from technical expert panels (TEPs), and
- An examination of gaps or limitations inherent in current approaches to measuring outcomes and service quality in this area.
Of critical relevance related to the inclusion of measure is its Meaningfulness or Importance as defined by stakeholders. Including people with a variety of disabilities. Further information with respect to the meaningfulness of this construct can be found in Section 2.6 of this submission.
In 2014, the Home and Community Based Services (HCBS) Settings’ Final Rule came into effect which stipulates that services must be delivered to individuals with disabilities in such a way that opportunities for people to have access to the benefits of community living, including experiencing a sense of belonging and inclusion are maximized. This agency level assessment requires measures that go beyond those used for compliance at the state and national level. Measures under development should assess outcomes based on the NQF framework that has been validated by multiple stakeholder groups. They need to be sensitive to the needs of both provider organizations (i.e., performance scores directly measure outcomes toward which an organization has the capacity or is currently attempting to achieve service quality improvement or demonstrate improvement in recipient outcomes, and the multiple populations support agencies now serve. Measures should also possess the capacity to longitudinally track progress on key indicators/ outcomes that are within the capacity of providers to potentially improve.
In order to be most useful in quality improvement and efforts, a measure performance score for social connectedness should include information related to (a) the extent to which a person has been able to develop and maintain valued social relationships of various types with preferred/valued others (family, friends, acquaintances in the community), (b) the degree to which these relationships need the individuals affiliation needs and minimize the risk of feeling of social isolation or loneliness, how important/valued to respondents is each type of activity, (c) how enjoyable/satisfied are individuals who participate in each type of activity, (d) the degree to which HCBS recipients get to engage in activities that are meaningful to them, (e) the extent to which people receive sufficient support to engage in these types of activities, and (f) to what extent does the support provided encourage people to develop their own social connections? This information needs to be collected in a manner that is person-centered and focuses on both what is important for the person AND what is important to the person.
Information/data available based on performance scores on this IDM have the potential to provide support agencies with a variety of information that can be used to (a) document overall service quality and facilitate policy and/or programmatic changes needed as part of quality improvement efforts, (b) identify specific aspects of the social connectedness subdomain where performance is less than desirable as well as those areas in which the agency is supporting exceptional outcomes, (c) longitudinally track changes that occur in service quality and social connectedness outcomes, and provide families and persons with disabilities with information they can use to help make informed decisions as to which providers they desire to provide services to their family members with a disability.
(A complete reference list is provided as a supplemental attachment in section 7.1.)
N/A
Numerator
The measure focus for the performance measure outcome is the number of individuals who have a composite score within the measure’s possible inter-quartile range (IQR). An individual's composite score is derived by summing the responses to 14 items on the Social Connectedness instrument. (See the response to section 1.6 for details on item scoring.) An individual's composite score can range from 0 to 40 where higher scores indicate a participant has greater connection to their community, friends, and/or family. The IQR is 10 to 30 and the numerator is the number of individuals whose composite scores fall in this range.
The numerator is calculated using a tabulation of composite scores from individual respondents. These individuals belong to the relevant population as defined in the denominator for this measure. Other details such as time period for data collection are equivalent to the denominator definitions and will be discussed in section 1.15a.
A composite score for an individual respondent is obtained by administering the Social Connectedness instrument to a respondent then calculating a sum score from the responses to all items on the instrument. This results in a composite score for one individual. See the attached data dictionary (1.13a) for a list of items, response options, and response scoring. An individual composite score (i.e., sum score) for the Social Connectedness measure can range between 0 to 40.
Included in the numerator are all individual respondents included in the denominator who have composite scores within the measure-derived inter-quartile range (IQR) for the measure. In other words, composite scores that fall within the middle 50% of possible scores that can be obtained for the measure. For the Social Connectedness measure this range is 10 to 30.
It is recommended that these calculations be performed prior to scaling of scores to be on a different, public-facing metric, e.g., T-scores.
Denominator
The target population for this measure is individuals receiving HCBS who are at least 18 years old and have a primary diagnosis of either: intellectual and/or developmental disability, physical disability, and psychiatric disability. Respondents must be able to complete an interview either independently or with assistance (e.g., support staff).
The target population for this measure is individuals receiving HCBS who are at least 18 years old and have a primary diagnosis of either: intellectual and/or developmental disability, physical disability, and psychiatric disability. Respondents must be able to complete an interview either independently or with assistance (e.g., support staff). The available research supports measure administration every four to six months.
Exclusions
None
None
Measure Calculation
The measure score for individual recipients is calculated by the sum of item responses on the instrument. See section 1.6 and the attached Data Codebook in 1.13 for the items and scoring codes on this instrument. Stratification does not modify the calculation of measure scores. Note that the measure score interpretation in section 1.17 is only applicable to this individual measure score.
Scores at the accountable-entity level are calculated using individual measure scores and incorporating the numerator and denominator criteria provided in sections 1.14/1.14a and 1.15/1.15a. For a calendar year, accountable entities will obtain individual measure scores for eligible HCBS recipients that they serve. The numerator is the number of individuals who obtained a score in the measure-derived interquartile range (IQR; see 1.14/1.14a). The denominator is the total number of eligible HCBS recipients that were assessed. The accountable entity score is this numerator/denominator ratio, which will be a proportion.
Each individual HCBS recipient should only be counted once in the numerator and denominator. In other words, an HCBS recipient with more than one assessment within a calendar year will still be only counted once for reporting purposes. For these individuals, use their most recent individual measure score that still falls within the calendar year.
A higher score indicates that there is a greater performance gap on measure outcomes for recipients at a given accountable entity. A higher proportion also suggests that the provider serves a wider population with greater variability in service needs. We have purposefully avoided an accountable entity score interpretation that is based on high (or the highest) individual measure scores as this would provide perverse incentives for those using our instruments. We also do not recommend higher or lower accountable entity scores be interpreted as “better” or “worse”. Rather, accountable entity scores should be accurate and informative.
See data dictionary attachment.
The data dictionary contains item and scoring schemes for questions that ask respondents about their Services Needs. These questions are found on the RTC/OM’s Demographic survey. This survey is appended to the instrument information in section 1.13a Attach Data Dictionary.
The Service Needs questions are used to develop a classification variable of a respondent’s functional disability (see section 5.4.2). The functional disability variable is defined as the overall level of services and supports a respondent is currently receiving. During field testing of the RTC/OM instruments, this collection of items was found to be superior in identifying level of disability compared to items that directly asked participants about their functional difficulties (see question 8 in the Demographic survey, attached in section 1.13a). In essence, most participants indicated low levels in functional difficulties despite varying levels of service needs. This indicates that services are effective: they reduce or eliminate the difficulties a person experiences in various areas of their life. As such, level of current service needs is a better indicator of functional disability.
Scores on the service needs items are summed to create a composite score of service needs for a respondent. Higher composite scores indicate greater service needs. Cut points are used to group individuals into functional disability categories:
- 0 - 10 = Few or no services & supports
- 11 - 20 = Moderate services & supports
- 21+ = Intense services & supports
Our research team is cognizant that polychotomizing a numerical scale into a few discrete categories is not best practice, as it reduces the amount of information (i.e., variance explained) in the outcome of interest. However, we chose this categorical approach to make allowances for those who have less technical expertise and want an easy-to-understand display of the relationship between level of functional disability and service needs.
HCBS Recipient
The Social Connectedness Measure is reported by HCBS recipients and administered either in person or through a HIPAA-compliant remote video conferencing platform. Currently, the instrument is available only in English; however, an interpreter can be used during the interview to improve accessibility. Response rates may be improved by offering accommodations that increase accessibility, such as environmental modifications for individuals with disabilities and visual displays of response scales.
Given that accountable-entities (i.e., HCBS providers) can vary significantly in the number of individuals that they serve and services that they provide, we do not require a minimum response rate. For example, some providers may only serve fewer than 5 individuals. However, for organizations that serve recipients with a wide range of service needs, then the sample used to calculate response rates should be representative of these service needs.
There is no minimum sample size that is needed to calculate a performance score at the individual HCBS recipient level. Performance scores for all of the IDMs submitted are based on instrument level score scores and it is these scores that are reported.
Given that the instrument was developed to be used at the provider level to document service quality and HCBS recipient outcomes, it is unlikely that the measures would be used to represent the quality of services received and outcome experienced by a single individual. As a result, while performance scores could be calculated on the basis of a single individual they would have little meaning in that isolated context. Focus group results and other discussions we have had with HCBS providers indicate that the most likely future use of the measures will be to (a) document the extent to which providers and sites within provider networks meet established benchmarks, (b) determine the extent to which quality improvement efforts have had a significant impact on service quality and HCBS beneficiary outcomes in targeted areas, and (c) potentially be used in the establishment of “report cards” for agencies within and between provider networks that can be used by external funders and families to determine programmatic strengths and areas in need of improvement and to facilitate informed decision-making when people with disabilities and/or their family members are looking to contract for services.
When used in this manner, sample sizes deemed adequate for analysis and interpretation of the submitted measures will depend on a variety of factors including, but not limited to the questions one desires to answer, comfort levels in committing Type I (false positive) and Type II (false negative) errors, the sampling methods used (i.e., probability vs. non-probability sampling) , the target population and its attributes. Attributes of HCBS samples include a wide variety of factors that impact sample size and include client demographic variables such as disability type, intensity of support needs and their variation within the population of interest, geographic location, the size of the population, the effect size one expects and a variety of other features of clients and the environment that could be relevant for answering a provider’s evaluation questions.
The University of Minnesota’s Institute on Community Integration, home of the RTC/OM has long-term history of working with HCBS service providers on a wide variety of evaluation projects that have included the use of measures similar to the ones we are submitting for review. These experiences suggest that if a provider desires to use performance scores aggregated across individuals to determine changes within that provider organization, a representative sample (adjusted for population size) that includes an absolute minimum of 35-50% of HCBS beneficiaries receiving services is needed to draw valid conclusions regarding quality improvement efforts.
Supplemental Attachment
Point of Contact
Regents of the University of Minnesota
Brian Abery
Minneapolis, MN
United States
Brian Abery
Institute on Community Integration
Minneapolis, MN
United States
Importance
Evidence
General Importance
Importance is defined as the relevance of measures to the lives of people with disabilities who receive HCBS and the potential of these measures to reveal important aspects of quality of life experienced by individuals across disability groups.
Importance was determined via three sources/processes. First, we began by considering all the domains and subdomains identified by the National Quality Forum’s (NQF) Framework for Home & Community Based Services Outcome Measurement (2016). The framework for HCBS outcome measurement was developed by a panel of NQF experts with the goal of identifying key areas to measure in order to be able to track the effectiveness of HCBS services. The final recommendation of the panel included 11 domains with 2-7 subdomains within each domain.
Next, we engaged stakeholders on whose lives HCBS has an impact in a series of feedback and planning groups. Stakeholders included: (1) Persons with disabilities (100 participants), including individuals with intellectual disability and developmental disabilities, physical disabilities, traumatic brain injury, mental illness, and age-related disabilities; (2) family members (84 participants); (3) providers (89 participants), and (4) program administrators/policy makers (47 participants) for a total of 320 participants in 58 small groups conducted nationally. Stakeholders took part in a participatory planning and decision-making (PPDM) process in which participants weighted each domain and subdomain of the NQF framework on a scale from 0-100 based on their perceived importance in determining the HCBS outcomes and quality.
As a third step in the process, we solicited the input of measurement experts in disability-related fields. Two groups of experts rated all subdomains, including the new subdomains of employment and transportation, in terms of feasibility, usability, and importance. These expert ratings were used in conjunction with stakeholder weighting from PPDM groups to narrow our development process to nine NQF subdomains on which to initially focus our work.
Specific Importance
Social connectedness is important to measure in relation to HCBS outcomes as social isolation and loneliness are common results of poorly managed support and care systems for individuals with disabilities. Its importance is amplified by the fact over the last several decades, people with disabilities, especially those with significant disabilities, have moved out of institutions where they experienced social isolation due to the segregate nature of the living settings and a dehumanized to approach to supporting them, including overmedication (Bigby, 2008; Gallagher, 2016). Further, having a socially connected life, with community-based experiences is one of the goals of the move towards deinstitutionalization for some groups and maintaining a fully community-based life for others. A social connectedness measure (score) is an important indicator as to whether the service system has merely moved individuals into community-based settings or is facilitating a fully inclusive community-based lifestyle. As Smull and Sanderson (2009), and others have stated, it tells us whether people with disabilities are merely living in the community or are of the community. Finally, social connectedness has important implications for the quality-of-life experienced by persons with disabilities that relate to a wide variety of other important outcomes because individuals who are socially connected are more likely to have a rich informal support network on which to rely improving the outcomes they experience in a wide variety of other areas (e.g., meaningful activity, employment, health and wellness, etc.).
(A complete reference list is provided as a supplemental attachment in section 7.1.)
Measure Impact
The intent behind the Social Connectedness measure is to impact the outcomes of Social Support (different types of support people receive from their social network), Belongingness (degree to which people with disabilities feel a sense of belonging in their community), and Reciprocity (the extent to which resources and support are both given and received). Social support is defined as an exchange of resources between individuals intended to enhance the well-being of the recipient and is a critical component of social connectedness, (Müller, Peter, Cieza, & Geyh, 2012). Social support provided by friends and families serve various functions, which can be categorized as social-emotional, instrumental, informational, or companionship (Cohen et al., 2000; Wong et al., 2010). Belongingness can defined as feeling like a valued, accepted member of the group. More specifically, Cobigo et al. (2012) state that to be socially included, a person must “have a sense of belonging in a social network within which they receive and contribute support, experience a valued social role and are trusted to perform that social role in the community.” Reciprocity in social relationships is an aspect of social connectedness and social support that needs to be addressed by measures of HCBS (Milner & Kelly, 2009). Reciprocity refers to that aspect of social interaction between individuals that entails persons being both the providers and recipients of various types of social support.
By receiving a Social Connectedness score, HCBS service providers will have an understanding of the level at which their clients think and feel socially supported, are able to exercise and experience reciprocity, and belong in their social network and community. This information will likely lead to improvements in HCBS services related to social connectedness that would in turn be reflected in improvements in the social connectedness outcome.
No unintended consequence of this measure has been identified.
(A complete reference list is provided as a supplemental attachment in section 7.1.)
Most of us, regardless of whether we have a disability, desire to live lives that are characterized as being of high quality. The extent to which people with disabilities are able to live the types of lives they desire is often far more dependent on the availability and effectiveness of the paid and unpaid support they receive from others than for the general population. The capacity to monitor the extent to which the quality of life of people with disabilities reflects their personal goals and dreams and is comparable to that of individuals without disabilities is critical if we are to understand the extent to which community-based services are doing what they are intended to do. This is especially relevant to the construct of social connectedness which may be conceptualized quite differently by different people.
At one level performance measures are needed to assure compliance with federal and state regulations governing HCBS. Performance measures, however, are also needed that are person-centered, longitudinal to assess outcomes associated with various aspects of life as well as the quality of support service recipients receive. These measures need to be sufficiently sensitive to change that the impact of policy, funding, and programmatic changes on the outcomes people experience can be determined over time. They would also preferably have the capacity to be used with different disability populations who receive community supports.
As a result of the variety of HCBS waiver programs and diversity of users, measurement of the quality of supports that the recipients receive and the social connectedness outcomes they experience is far from straightforward. A nuanced approach needs to be taken that is responsive to a wide variety of personal and contextual factors. This process needs to be decidedly different than that currently used in medical context due to the dissimilarities in the constructs measured. Unlike many outcome measures related to health the extent to which people with disabilities experience a sense of social connectedness is both more complex and difficult to assess because it must be conceptualized as a latent construct.
A second set of critical contextual factors for which one needs to account are the policies and regulations under which HCBS is implemented which vary significantly between states in the U.S. At the same time. In order to be confident that performance measures associated with HCBS adequately assess both the quality of services and the outcomes people with disabilities experience, data are needed with respect to their reliability, validity, and sensitivity to change. Indicators of quality and unmet support needs as directly perceived by service recipients must be considered paramount when developing, administering, and interpreting results based on these measures.
Since the deinstitutionalization movement of the 1970s and 1980s there has been great interest in assessing the degree to which HCBS recipients experience a sense of social connectedness and the quality of services they receive to support this outcome. During this period, CMS has championed the development and maintenance of the Home and Community-Based Services (HCBS) Quality Measure Set (QMS) - a set of quality measures for Medicaid-funded HCBS. The QMS is intended to promote more common and consistent use within and across states of nationally standardized quality measures, create opportunities for CMS and states to have comparative quality data on HCBS programs, drive improvement in quality of care and outcomes for people receiving HCBS, and support states’ efforts to reduce disparities in their HCBS programs.
Developed through the support of CMS the QMS is intended as a resource for states and thus focuses on the compliance level. Although Measure Summaries include technical specifications, links to testing reports, and information about the measures’ alignment with the CMS Meaningful Measures Initiative, CMS Measures Management System Blueprint measure criteria, section 1915(c) waiver assurances and sub-assurances, and health equity variables the approach taken is decidedly medical in orientation. As such, “performance measures” including those related to social connectedness are most often conceptualized as single items. Although this might be appropriate to measure discrete healthcare outcomes, most psychologists, and measurement experts would argue that this approach is inadvisable to use when one is attempting to measure latent variables. Latent variables, including a person’s sense of social connectedness, are constructs that cannot be directly observed but instead are inferred from their relationship with other, directly measurable variables. Examples include intelligence, self-esteem, social connectedness, and community inclusion. The latter examples are among the domains and subdomains included in the model for HCBS Outcome Measurement produced by the National Quality Forum (2016). Most of the constructs included in this framework meet the criteria for being considered latent variables. In all but a few cases, latent variables should not be measured with single items because single-item measures all too often lead to inaccurate representation of the latent construct and limit the ability to assess measurement error. Using composite measures composed of multiple items provides more robust evidence of construct structure, allows for estimation of measurement error, and enhances the overall validity and reliability of the measure.
The National Core Indicators (NCI/NCI-AD) (see - https://www.nationalcoreindicators.org ) is currently the most widely used tool in the U.S. for the assessment of outcomes associated with the receipt of HCBS. The instrument was developed and validated as a state-level compliance measure and does an excellent job when used at that level. It is not, however, intended to be used at the provider or individual level for quality improvement, service plan development, and/or outcome assessment. In addition, although the NCI includes indicators in a variety of areas, it is intended to be administered (and was validated) at the instrument level as opposed to on an indicator-by indicator basis. Users are therefore required to administer items related to all indicators as opposed to only those in which there is a specific interest. It should also be noted that although NCI and NCI-AD have been used with populations beyond those for which they were intended (i.e., people with IDD, physical, and age-related disabilities) these tools have only been validated for use with the limited disability groups noted.
CQL’s Personal Outcome Measures (CQL, 2017) is one of the better developed and validated HCBS Outcome tools and part of a commercially available system of assessment and quality improvement. It has been validated with a much wider variety of people with disabilities than the NCI and possesses good psychometric properties. However, the instrument is time consuming with respect to administration (715 items; 12) limiting its feasibility for many providers. In addition, the CQL-POM, as part of a quality improvement package, is proprietary and not inexpensive to use with onsite administration training alone costing $7,000.
A third approach to outcome assessment in the human services field that has been championed by CMS is the HCBS CAHPS Survey. The CAHPS is a questionnaire with sixty-nine core items developed for measuring the experiences of people with disabilities who are HCBS recipients. The CAHPS, unfortunately, currently has limited data available with respect to its validity or reliability. Internal consistency reliabilities for seventeen of its nineteen measures initially submitted to the NQF for endorsement fail to meet even the most basic criteria for psychometric acceptability, there are serious questions about the representativeness of the sample used for the field study as well as the evidence presented to support validity, and in a number of indicator areas, there appears to be a ceiling effect with the overwhelming majority of respondents indicating the highest possible level of service quality or personal outcomes (Nyce, et al, 2020).
In addition to the individual shortcomings of the most widely used HCBS outcome measures, there are additional limitations related to the measurement of social connectedness that cut across these instruments as well as other HCBS outcome assessment tools that contribute to the need for development of new measures. The first of these entails the small percentage of items included in available HCBS outcome measurement instruments intended to measure social connectedness that meet the criteria for being person-centered. Recent decades have seen a growing focus on providing HCBS in a person-centered manner thereby supporting outcomes that are both important for and important to the person. No longer is it sufficient to focus services on what is important for the person. Rather, supports must reflect both what is important for and what is important to the person (Smull, 2017). Current measures of social connectedness in the measures/instruments noted above fail to effectiveness accomplish this task. The assumption is all too often that more social connections are better. There is also little emphasis in current approaches to the assessment of social connectedness in measuring the extent to which people have (a) the degree of connectedness they prefer, (b) in the contexts which reflect their preferences, (c) with the people with whom they most desire to be socially connected, and (d) are supported to develop relationships that are reciprocal rather than hierarchical in nature.
In addition to the CMS/HCBS system’s move toward person centered service provision, there are legal and compliance motivations within the HCBS environment that support the need for measurement that is person-centered. In 1999 the U.S. Supreme Court ruled in Olmstead v. L.C. that unjustified segregation of persons with disabilities constituted discrimination and was in direct violation of title II of the Americans with Disabilities Act. Under the Olmstead decision (1999), as well as the HCBS Final Settings Rule (2014) states in the U.S. are now obligated to provide services for people with disabilities in the most inclusive community settings possible as well as support them to achieve desired life outcomes. To fully measure the effectiveness of programs that provide services and supports in meeting Olmstead and recent CMS requirements related to HCBS, a person-centered approach to measurement is needed. The approach needs to emphasize the degree to which the outcomes experienced by HCBS recipients match their needs and preferences and move them forward in achieving desired life outcomes.
HCBS outcome measurement, however, has not kept pace with advancements in person-centered thinking as it relates to providing supports to people with disabilities. The concept of person-centered outcome measurement has been inadequately defined and is frequently misunderstood, including by those in the measurement field. A study of 140 outcome measures used with HCBS populations (RTC/OM, 2017) found that only 36% of the items included in these tools were person-centered in nature. Although some outcome measures (e.g., the CQL-POM) are more person-centered than others, the overall results of this study clearly indicate the need for approaches to assessment that place greater priority of assessing outcomes within the context of what is most important to individual.
A second shortcoming that cuts across the majority of current HCBS outcomes measures is the lack of evidence that they are sufficiently sensitive to change over time that can be used in a longitudinal manner. Some developers, such as HSRI (NCI-ASC/NCI-AD) explicitly state that their measures are not intended to be used longitudinally. Others (e.g., CQL, CAHPS) have yet to provide sufficient evidence that, when used in a longitudinal manner, their measures are sufficiently sensitive to change that they can be used as evidence of the effectiveness/efficacy of quality improvement efforts, changes that take place in a HCBS recipient’s life, disability policy or funding or as part of value-based payment systems.
A third reason to think about the development of new outcome measures for HCBS emanates from the resources needed to administer measures at a time when the human services field is experiencing serious workforce shortages. All of the tools mentioned above are intended to be administered in their entirety as full instruments. They are neither modular in format allowing for administration focused on only one or a few indicators, nor tiered and able to provide both a quick general overview of indicators as well as a more in-depth assessment needed for having utility at the provider level.
A final overarching rationale for considering the need and development of new measures is that the best developed and most well-researched measures that are currently available in the field are proprietary and part of measurement systems. States as well as large providers typically have the funding to pay for the use of these tools. Provider agencies, especially those of the small variety, however, often do not. As a result there is a need for measures at the provider level that are (a) able to be used a little to no cost, (b) person-centered, (c) of a composite nature with the ability to assess latent constructs, (d) based on recent theory and research pertaining to the outcome domains and subdomains assessed, (e) easily scored and interpreted, and (f) sufficiently sensitive to change over time so that they can be used longitudinally.
(A complete reference list is provided as a supplemental attachment in section 7.1.)
Stakeholders, particularly those who have disabilities and their supporters, should be at the heart of measurement development. In order to ensure that HCBS outcome measures are of high quality, the measure development process must include, from its initiation, input from stakeholders - most importantly the intended population with which the measures will be used. This need has been affirmed by NIDILRR, ACL, and the Centers for Medicare and Medicaid Services (CMS, 2019). Using a sound HCBS outcome measurement framework that has evidence of content validity provided by stakeholders including people with disabilities; putting all measures developed through multiple expert panel reviews; undertaking cognitive testing with people with a variety of disabilities are necessary strategies or processes in which one must engage to ensure for quality measure development.
The target populations for the submitted measures includes people with intellectual and developmental disabilities, psychiatric disabilities, physical disabilities, and TBI/ABI as well as age-related disabilities. Although the large majority of people with such disabilities possess the capacity to articulate their thoughts and feelings about the outcomes in question and their importance, it must be recognized that some do not. The intensity of their support needs may be such that they experience difficulty understanding questions and articulating their thoughts and feelings. Not only are these individuals at elevated risk for experiencing poor services and outcomes but most HCBS performance measure programs are not set up to reflect their experiences. The RTC/OM development team therefore instituted a process in which not only HCBS recipients (as opposed to patients) provided input into the measure development process, but other stakeholders were included as well. These consisted of family members of people with the above noted disabilities (who are often direct caregivers on either a part or full-time basis), paid caregivers, and HCBS program administrators who in the end will be responsible for using performance measure data to improve both services and outcomes. At multiple steps along the measure development process, these individuals were consulted and their input incorporated into the measure development process.
The social connectedness measure submitted for review was based on:
- The results of a national content validation study of the National Quality Forum’s HCBS Outcome Measurement Framework using a Participatory Planning and Decision-making (PPDM) process.
- Utilization of multiple Technical Assistance Panels (TEPS) that included people with disabilities as well as members of other stakeholder groups
- Input from an RTC/OM Center Advisory Committee composed of people with a variety of disabilities in addition to other stakeholder groups, and
- Extensive cognitive testing of measure items and response options, and
- Vetting of measures by representatives of provider agencies
PPDM Process. Of critical relevance related to ensuring that HCBS recipients for whom the measures under development were intended viewed them as meaningful, we began by considering all the domains and subdomains identified by the NQF Framework for Home & Community Based Services Outcome Measurement (2016). As our initial step in determining the meaningfulness to people with disabilities of the social connectedness domain, RTC/OM staff engaged stakeholders from 29 states on whose lives HCBS has an impact in a series of participatory planning and decision-making (PPDM) groups. Stakeholders included: (a) people representing with disabilities (100 participants), including individuals with IDD, physical disabilities, traumatic brain injury, psychiatric disabilities, and age-related disabilities; (b) family members of people with the above noted disabilities (84 participants); (c) representatives of HCBS provider agencies (89 participants), and (d) state level HCBS program administrators/policy makers (47 participants) for a total of 320 participants who took part in 58 small (4-6 person) groups.
The PPDM process initially included meeting with homogeneous (with respect to disability and stakeholder type) stakeholder groups and providing them with an opportunity to evaluate the original NQF framework. They were provided with the opportunity to add to it, remove domains and/or subdomains they believed were not important, and then stipulate which personal outcomes and service characteristics were most important to measure. Following stakeholders reaching consensus with respect to the domains and subdomains of the original framework they wanted to add or remove, members of each group took part in a process in which they first independently assigned importance weights for each domain and subdomain of the original NQF framework on a scale from 0-100 (or 0-10 for persons with cognitive challenges) based on their perceived importance in determining the HCBS outcomes and service quality. As part of the PPDM process, stakeholders then discussed their weightings first at the subdomain level and later at the domain level examining why people in their group assigned the importance weightings they did. Stakeholders were then given the opportunity to assign a second set of importance weightings taking into consideration what they had heard during their discussion.
Across all groups, the mean importance weighting for the Community Inclusion domain was 91.5/100 and the Social Connectedness subdomain 92.75/100 (SE = .63) indicating that overall stakeholders considered measurement of this outcome as of extremely high importance to measure. Stakeholders who took part in the PPDM groups clearly indicated that social connectedness was an outcome that was important to measure as part of the larger domain of community inclusion. The social connectedness performance measure concept aims to address the need for a sound measure to assess the level of engagement of people who use HCBS with family, friends, and preferred others in the community.
Technical Expert Panels. As a second step in the process of developing measures, we solicited the input of people with lived experience with disability (N = 9) as well as measurement and content experts in disability-related fields (N = 12) for a series of technical expert panels (TEPs). Four TEP groups were formed and initially asked to rate the importance, utility, and feasibility of the social connectedness subdomain. Across stakeholder groups using a 1-5 point Likert-type scale, the social connectedness subdomains received the following weigthing with respect to theirfeasibility (Mean = 4.1/5.0), usability/utility (Mean = 4.4/5.0), and importance (Mean = 4.6/5.0), as well as provide an overall score (Mean = 4.4/5.0) for the subdomain. This information, in combination with PPDM results, a systematic review of the literature, and analysis of existing HCBS outcome measures indicates both the meaningfulness of the social connectedness construct and perceptions among stakeholders that it is important to measure.
At follow-up TEP meetings following the initial development of items for those subdomains that were selected to be a focus of RTC/OM work, TEPs engaged in a similar process using 1-4 point Likert-type rating scales to rate the relevance, importance, accessibility/understandability, and accuracy of each item developed for the social connectedness measure under construction. Based on this information low-rated items were jettisoned and replaced with new ones. Mean scores for social connectedness items were as follows: Relevance (Mean = 3.48/4.00), Importance (Mean = 3.43); Accessibility /Understandability (Mean = 3.20); and Accuracy (Mean = 3.0).
RTC/OM National Advisory Group. In conjunction with the results of PPDM groups and TEPs, ongoing input with respect to determination of the meaningfulness and importance of the social connectedness measure was also solicited from our national advisory group of HCBS stakeholders. The RTC/OM Center Advisory Committee confirmed the meaningfulness of this measure, especially those components that provide an idea as to the reciprocal nature of the social connections a person has developed and provided valuable feedback not only with respect to the item content of the measures under development but also measure administrator training content and the medium (live versus virtual using HIPAA compliant version of Zoom Meeting) through which interviews would be conducted.
Cognitive Testing. The terminology used to describe outcomes and services can vary based upon disability group membership, the settings in which supports are received, and/or the services and supports themselves. The term “person-centered,” for example, has different meanings when used with members of different disability groups. Thoroughly testing with people with disabilities, the language and terminology used in measure concepts, and even how the measure is implemented is, therefore, was undertaken to ensure their meaningfulness across HCBS recipients. Cognitive testing (CT) was designed to obtain direct input from respondents to verify their interpretation of items and the words of which they are composed to ensure that these match the developer’s intent (Ericsson & Simon, 1980; Kramer & Schwartz, 2017; Willis, 2005; Willis, et al., 1991;) as well as contributing to the validity of measures (Castillo-Díaz & Padilla 2013). RTC/OM staff used a cognitive testing strategy referred to as the “Think Aloud Method” to address the core cognitive components of item responding as included in the Cognitive Aspects of Survey Methodology (CASM) model: comprehending the item, retrieving the information needed to answer the item, making a judgment, and reporting a response (Tourangeu, 1984; 2018). This approach provided yet another way to involve people with disabilities in the measure development process and ensuring meaningfulness of the measure.
Focus Groups with Potential Measure Users. To ensure meaningfulness, the performance measures under development, also underwent vetting by representatives of provider agencies. After final performance measure refinement based on the results of piloting and field-testing the final measures under submission were presented to two separate groups of potential users utilizing a focus group format. Participants were recruited from a large human service organization in Minnesota that provides residential, home health, and employment services, and a statewide network of human services providers located in Michigan (Total N = 23). Measures were initially shared with participants several days prior to scheduled focus groups. Groups were initiated with RTC/OM providing background information and answering questions about the measures themselves, their administration, analysis, and use. After facilitators were assured that participants’ questions had been answered group discussion focused on, (a) the importance of the measures, (b) their overall quality and comprehensiveness, (c) the feasibility of provider agencies using the measures, and (d) the utility of the performance measures developed and how providers could foresee using them.
(A complete reference list is provided as a supplemental attachment in section 7.1.)
Performance Gap
Measures are being submitted for initial endorsement.
Care Gaps
Closing Care Gaps
This domain is optional for Spring 2025.
Feasibility
Feasibility
Administering the measure as an interview requires approximately 10 minutes per Home and Community-Based Services (HCBS) beneficiary. The primary human resource burden includes the time of a trained interviewer to administer the measure and a data entry specialist or the interviewer themselves to enter the responses into a secure data system. Minimal additional personnel time is needed for data validation, which may involve reviewing and cleaning inconsistent or incomplete data, and follow-up with interviewers to clarify discrepancies. While these tasks include some investment of staff time, they are essential to ensuring data quality and integrity. To support accurate and valid data collection, organizations may also use supplementary resources such as interviewer training sessions, standardized data entry protocols, and processes to conduct periodic checks of the data. Despite the staff requirements, the burden on respondents was minimal. During testing, the vast majority of HCBS recipients reported a positive experience with the interviews. Many beneficiaries expressed appreciation for the opportunity to share their perspectives and discuss their services and outcomes with interviewers.
The composite score from the Social Connectedness measure will be available through electronic platforms, such as Qualtrics or incorporated into existing electronic systems providers already use. It is important to understand that HCBS data are by definition not medical data and therefore require different electronic systems from the usual hospital managed system. The HCBS field is not as centralized at the provider level and their electronic systems are developing.
That said, in addition to working with the systems providers may already been using, we are in the process of developing an electronic system at the University of Minnesota’s Institute on Community Integration that houses this initiative. This system will offer providers an opportunity to utilize our electronic system and technical assistance to use the system to house their scores for a negotiated fee.
The measure score is derived from information from participants with disabilities or their proxies via an in-person or a Zoom interview. The cost and burden would be associated with the time it takes data collectors/someone designated to conduct these interviews to collect this data and how much they would be paid per interview/per hour. The measure itself would be calculated automatically using a formula embedded into an electronic data collection system that would also be used for performance reporting.
As part of one of the nation’s prominent research universities with a large academic health sciences program, the Institute on Community Integration and RTC/OM have access to a wide variety of servers/data storage systems that meet or exceed all HIPAA security requirements and can be used to ensure the privacy/confidentiality of personally identified information. All clinical and human subjects’ data collected as part of RTC/OM performance measures will be secured with a University of Minnesota-approved resource at all times for the full extent of their life. This is true even when data has been de-identified. University approved methods of storing, clinical and human subjects’ data that will be used by the implementer (RTC/OM) include servers exclusively devoted to and supported by the University’s Health Sciences Technology (HST) group. HST supports University departments that need to store Private Highly Restricted data. The HST Operations and Infrastructure team supports and manages applications and infrastructure to meet University standards regarding HIPAA compliance. HST will work with RTC/OM staff to identify onboarding and maintenance requirements necessary to comply with UIS standards for PHR systems and data. Operating systems include professionally managed RHEL (Linux) and Windows Server environments. HST offers multiple storage options for data, documents, and folders to meet a variety of clinical, research, and storage needs. Network storage (SMB/NFS) is available on the Twin Cities campus for Healthcare Component (HCC) departments. The University’s Health Information Privacy & Compliance Office (HIPCO) and its Institutional Review Board RB strongly encourage the use of limited datasets to maintain confidentiality when some identifiers are needed and this recommendation will be followed. A Limited Data Set is a dataset that contains a limited set of indirect identifiers, and it's only used within the University's Health Care Components or under a Data Use Agreement (DUA). This will allow implementers (RTC/OM) to access data with limited privacy risks while still being able to provide critical service quality and outcome data to RTC/OM measure users in a way that has a high degree of utility. Key aspects of creating a Limited Data Set will entail:
(a) Removing Direct Identifiers: All direct identifiers including names, street addresses, and telephone numbers will be removed.
(b) Including Limited Indirect Identifiers: Certain indirect identifiers, such as dates (e.g., date of birth, death, admission), and geographic information (city, state, zip code) will be included
(c) Creating Data Use Agreements (DUAs): When PHI in a Limited Data Set is shared with a third party, a Data Use Agreement (DUA) will first be established and approved by the UMN’s IRB, Sponsored Projects Administration and Office of General Counsel. This agreement will outline the permissible uses of the data and ensures compliance with HIPAA.
(d) Review and Approval Processes: The process for creating and sharing the Limited Data Set will include review by HIPCO, the IRB, and the Sponsored Projects Administration (SPA).
The final measure is a result of multiple feasibility assessments. First, we conducted Participatory Planning and Decision Making (PPDM) groups with people with disabilities, family members, and staff to weigh importance of the NQF domains and subdomains. This process assisted our team with the selection of measure concepts to prioritize for developing within HCBS. Second, the items and their response options from which the measure was composed was reviewed by a technical expert panel to test whether the measure reflected the intent behind the measure concept. Third, the measure underwent cognitive testing during which the items and their response options from which the measure was composed were tested by people with intellectual and developmental disabilities, aging needs, TBI, mental health needs, and physical disabilities. We wanted to assure that the measure was reflective of its measure concept as understood by people with different challenges. Fourth, the measure underwent pilot testing in two states (MN, PA). Feasibility was one of the main objectives of the pilot study during which we were able to identify items and response options that were either not providing us with information that reflected the measure concept accurately or those that did not contribute meaningfully to the measure. Based on all these stages to the feasibility assessment, we used an iterative process to refine the measure. The final version was used for psychometric testing in the RTC/OM National Field Study.
Proprietary Information
The measure is not proprietary, but the training and technical assistance will have an associated cost.
If organizations and users have the requisite knowledge (e.g., a Quality Assurance staff person with knowledge of HCBS processes) to use and score the measure then proprietary training would not be necessary.
Training that is available (online or in-person), focuses on providing potential users with background in order to do high quality measurement. More specific training on the measures we have developed, which is focused on appropriate use, administration and interviewing techniques, strategies for data analysis, and interpretation.
Scientific Acceptability
Testing Data
The data presented in this submission were collected on a rolling basis during a multi-year field study of the RTC/OM measures between Spring 2021 and Spring 2024. This was a longitudinal data collection effort with three waves of data collection for each participant. However, only results from the first wave of data collection for each participant are presented unless otherwise noted. The first point of data collection for participants occurred between May 2021 and February 2024.
Field not required Spring 2025.
To mitigate autocorrelation and other statistical artifacts during data analysis only the first wave of data collection is used for data analysis, with one exception. The one exception is the test-retest analysis which could have been collected during any wave. Test-retest responses were only collected once per participant.
Providers in the sample were recruited through a national directory of HCBS providers maintained by Medicaid.gov, as well as through networks of known HCBS providers and contacts recruited by University Centers for Excellence in Developmental Disabilities and other organizations contracted to support recruitment and data collection in several states (e.g., Utah, Pennsylvania, Florida, Georgia, Kansas). Additional HCBS providers were referred by participants who responded to national recruitment efforts (e.g., website, newsletters). Providers were not recruited for the study in every state, attempts to expand the representation of the sample were made in every state. This resulted in 67 organizations formally participating in the study across the states of Minnesota, Kansas, Florida, New Jersey, Pennsylvania, Massachusetts, Georgia, Arizona, Kentucky, Iowa, California, and New York. The size of participating organizations, in terms of the number of beneficiaries served, ranged from 10 or fewer to several hundred, with a variety of sizes in between. In Kansas, three large Managed Care Organizations also participated, as HCBS in that state are administered through them. The types of HCBS provided included residential services, in-home supports, home health or skilled nursing, employment services, community access, financial assistance, transportation, and more.
HCBS beneficiaries were recruited either directly by participating provider organizations through direct outreach or recruitment materials (e.g., flyers, videos), or through national-level postings and newsletters inviting participation. Each participant was screened to verify eligibility, including age and receipt of HCBS or HCBS-like services. All participants in the study who expressed interest in participating and met inclusionary criteria (age, currently receiving HCBS or HCBS-like services, able to provide consent/assent). Participant ability to understand the measure questions was first evaluated with the University of California, San Diego Brief Assessment of Capacity to Consent (UBACC). Capacity was also closely monitored by interviewers and if significant concerns about the validity of responses were raised, the participant’s data were excluded.
Participants reported their primary disability as Intellectual or Developmental Disability (181, 61.4%), Physical Disability (59, 20%), Traumatic Brain Injury (24, 8.1%), Psychiatric Disability (17, 5.8%), Age-related Disability (4, 1.4%), or Other (10, 3.4%). The age range of participants was between 19 and 76 years old. Participants between ages 18-34 made up 37.9% of the sample, 35-54 were 44.7% of the sample, and the remaining 17.4% of the sample were 55 or older. 160 participants (54.2%) identified as male, 133 participants (45.1%) identified as female, and 2 participants (<1%) identified as “other”. Participants identified their race as White (188, 63.7%), Black or African-American (66, 22.4%), Hispanic/Latino (12, 4.1%), Asian (2, <1%), or “Other race not listed” (5, 1.7%). No participants identified as solely American Indian or Alaska Native. Approximately 7.5% of participants identified with more than one race.
Reliability
Internal consistency reliability and test-retest reliability methods were used to assess the reliability of person-level outcomes. Internal consistency reliability is a way to test the generalizability of a set of items to the broad domain of items that could have been used on the test. This type of reliability is used to gauge the level of error in content sampling of the items as well as errors of measurement arising from sampling, administration, or other secular effects. On the other hand, test-retest reliability is an estimate of errors around an examinee's “true” score over a short time frame (Crocker & Algina, 2008).
Internal consistency reliability of measure responses was assessed with Cronbach’s alpha, a well-researched and widely-used method that was listed by the NQF as a method to demonstrate scientific acceptability (NQF, 2021). Test-retest reliability was evaluated using PPM correlations between participant composite scores across time points. Test-retest data were collected 10-14 days apart.
All calculations were performed in R (2025; version 4.4.0 or later) with the psych package (Revelle, 2025). A full data matrix of all respondents was loaded into R containing participant responses to all items on the instrument. For Cronbach’s alpha calculations, a correlation matrix from these responses was computed using matrix smoothing and full information maximum likelihood (FIML), the latter an optimal technique for handling missing data (Enders, 2010). The sample size used was the average number of complete responses across all items. For test-retest reliability, missing data were handled by pairwise deletion.
(A complete reference list is provided as a supplemental attachment in section 7.1.)
The attachment in 5.2.3a provides reliability testing results at the measure level. Standardized Cronbach’s alpha and test-retest correlation statistics are highlighted in yellow. The detailed report on internal consistency also includes 95% confidence intervals as well as leave-one-out item analysis. Alongside the test-retest correlation coefficient is also reported the number of subjects and items in the sample.
Internal consistency reliability (.84) and test-retest reliability (.93) were found to be excellent. The results show that scores generated from the instrument contain a relatively small amount of measurement error and supoprt the instrument's use.
Validity
There were two approaches used to perform validity testing at the encounter-level. Content validity and construct validity were the two approaches used. An in-depth discussion of the content validation process undertaken in Study 1 of the RTC/OM project was provided in section 2.6 and will not be repeated here.
Construct validity of measure outcomes was evaluated with parallel analysis (PA) via scree plots as well as exploratory factor analysis (EFA). Both were used to evaluate the factor structure of each measure. Similar to reliability analyses, all calculations were performed in R. First, to determine the number of factors to retain during EFA, parallel analyses were performed then compared with the theoretical structure proposed during measure development. This helped guide the number of factors that were fit during the EFA procedure.
EFA models were fit with the psych package using ordinary least squares . Oblique solutions were produced with Oblimin rotation. Missing data were handled via full information maximum likelihood (FIML) when computing the correlation from the full data matrix (see section 5.2.2).
The attachment in 5.3.4a provides the results of parallel analysis and exploratory factor analysis for the Social Connectedness measure outcome. We hypothesized that the data would best fit a one-factor model, and parallel analysis suggested retaining two factors. However, the associated scree plot included with the parallel analysis indicates a strong single factor and so a one-factor EFA was fit to the data. The results of the one-factor EFA model are presented below the parallel analysis.
The scree plot recommended that we retain a single factor for the final results and the hypothesizes structure suggested retaining one factor. Given that parallel analysis can overfit the data, we decided to retain one factor in the final model. The model showed moderate to high factor loadings with fit statistics TLI = .85 and RMSEA = .08 demonstrating a good fit of the single factor model.
Accountable entity-level validity:
In 2024, a focus group was conducted with six leaders of Home and Community-Based Services (HCBS) organizations in Minnesota. During the session, participants received information about the measure under discussion, including the associated outcome area (Social Connectedness) and the method used to calculate the performance score. Participants were then asked to provide input on several aspects of the performance score using a scale ranging from 1-4:
Relevance: How relevant is the performance score to the HCBS services they provide? (Mean = 4.0)
Representation: To what extent does the score represent the employment outcomes it is intended to measure? (Mean = 2.83 )
Accuracy: Does the score accurately reflect the outcomes experienced by their beneficiaries? (Mean = 2.67 )
Feasibility: Would their organization have the capacity to collect the data needed for this measure? (Mean = 3.17 )
Usefulness: How useful would the performance score be in helping the organization support its beneficiaries? (Mean = 3.0)
These results indicate that, overall, potential users of the measure rated the performance score as having adequate face validity.
Risk Adjustment
The National Quality Forum (NQF) emphasizes the importance of risk adjustment in evaluating outcome measures to ensure that potential threats to validity are addressed. Sociodemographic factors such as income and race have been explored as possible elements for risk adjustment by the NQF, which aims to develop guidelines in this area. In 2017, the NQF reviewed 303 submitted measures to assess their applicability for adjusting social risk factors that could affect health outcomes. The NQF panel recommended that these social risk factors follow the same criteria as clinical and health-related risk factors, although it noted a lack of a conceptual framework for their inclusion (National Quality Forum, 2014).
In the context of risk adjustment for this study, the NQF panel advised that sociodemographic factors should: (1) have a conceptual link to the outcome,(2) show an empirical relationship to the outcome , (3) display variability, (4) exist prior to intervention or care, (5) remain unaffected by intervention or policy changes, (6) be resistant to change, (7) be based on data that can be easily collected, (8) uniquely explain variations in the outcome, (9) contribute to the overall model, and (10) be considered valid and acceptable (NQF, 2014). These guidelines help differentiate risk adjusters from other variables.
More recently, the NQF conducted a review and convened a technical expert panel to develop further guidance for developers of outcome measures (National Quality Forum, 2020). They found that social risk factors mostly emerged at the individual and community levels, derived from various socioeconomic and demographic indicators. Functional risk factors, however, were often specific to individuals and based on self-reported survey data, with fewer clear definitions available. Statistical methods such as regression analyses were frequently used, though other models like hierarchical linear modeling were also applied to accommodate a broader range of risk factors.
Other risk adjustment models reflect similar themes to the NQF’s recommendations. For example, the Centers for Medicare and Medicaid Services (CMS) sought expert input on risk adjustment, and the Department of Health and Human Services (HHS) reviewed and integrated those recommendations into 10 key principles for risk adjustment (Centers for Medicare and Medicaid Services, 2016). Five of these principles overlap with the NQF’s guidelines, including recommendations that risk adjusters should be clinically relevant, predictive of medical costs, based on adequate sample sizes, encourage specific coding, and maintain internal consistency.
Additional support for the NQF’s guidelines comes from the Research Agency for Healthcare Research and Quality (Velentgas, n.d.), which recommended that risk adjustment should not include variables affected by the outcomes, that variable selection should be based on prior knowledge of their relationship to outcomes, and that risk adjusters should have statistical ties to outcomes.
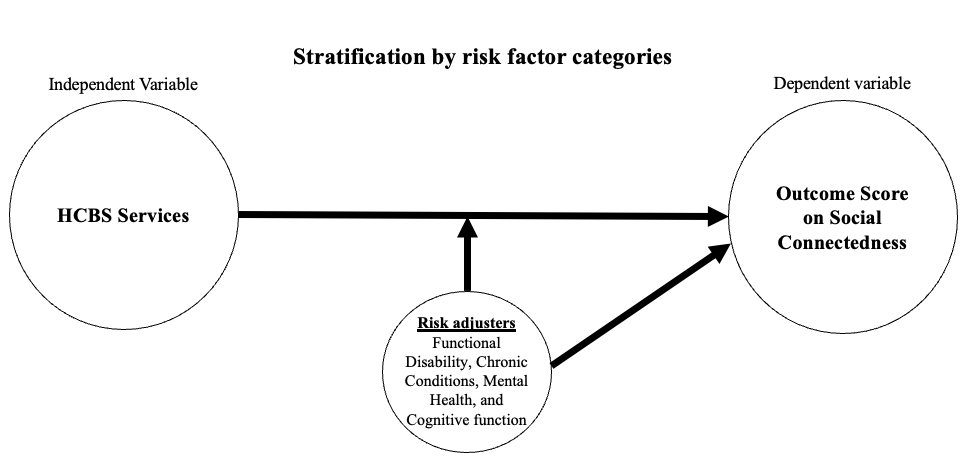
In our systematic review of studies involving risk adjustment for individuals with disabilities receiving home or community-based services, we categorized studies based on the type of risk adjusters used and their relation to specific outcomes. Panels helped prioritize the risk adjusters, and our findings suggest that four factors—chronic conditions, functional disability, mental health status, and cognitive functioning—may be recommended as candidate risk adjusters (Houseworth et al., 2022).
We have not currently collected data related to mental health status and cognitive functioning due to feasibility issues during the pilot study. We did collect data allowing us to stratify by functional disability/chronic conditions. Therefore, we are currently unable to determine if large difference between providers on those factors would impact performance scores, as the literature suggest. This could lead to some inappropriate conclusions.
(A complete reference list is provided as a supplemental attachment in section 7.1.)
The attachment in 5.4.4a contains descriptive statistics across levels of functional disability for the measured outcomes. There are three levels of functional disability ranging from low to high service needs. Descriptive statistics reported for each level of functional disability are means, medians, standard deviations, minimum scores, and maximum scores.
The attachment in 5.4.4a also contains an ANOVA analysis to determine if there were significant differences between the aforementioned functional disability categories on the measure outcome. There were statistically significant differences found between these functional disability categories. Post hoc analyses were conducted using Tukey’s Honest Significant Difference, and it was found that those receiving “Few or no” services and supports reported significantly lower levels of social connection compared to those receiving “Moderate” or “Intense” levels of services and supports.
ANOVA results demonstrate a significant difference between levels of functional disability and participants' levels of social connectedness. Notably, both moderate and intense levels of functional disability (as measured by services received) were related to higher levels of social connection. This seems to show that those with more staff support also have a great degree of social connection with others.
Use & Usability
Use
Usability
The measured entities are bound by CMS regulations to provide HCBS services to support QoL outcomes in alignment with HCBS Final Settings Rule and Access Rule. As a minimum, this measure will provide evidence for the level of social connectedness, including social supports, reciprocity and belongingness, of their clients as indicators of Access and HCBS. There is currently a gap in measures available to provide reliable and valid data to service providers on HCBS outcomes, including the outcome of social connectedness (UMN RTC/OM, 2020). The RTC/OM measure of social connectedness has the potential to fill this gap for providers to be able to report to CMS on their progress toward HCBS and Access. Most importantly, providers will be able to make informed judgments about the way people with disabilities receiving HCBS experience their services and their effectiveness to improve/maintain their social connectedness.
In our work with PAVE in CA, the measure score will be used to validate a PAVE measure score related to social connectedness to assess the quality of services as related to the Quality Incentive Program (QIP) for CA disability service providers. A pilot study is currently under way to collect data using RTC/OM and PAVE measures.
(A complete reference list is provided as a supplemental attachment in section 7.1.)
As with the use of any measure to increase outcomes, the use of the RTCOM Social Connectedness measure may have potential unintended consequences, particularly if performance on the measure is tied to incentive or value-based payment programs. Poor performance on the measure could lead to reduced resources or negatively influence future funding decisions for provider organizations. In response, entities (HCBS providers) may reallocate resources from other critical areas to focus narrowly on improving measured social connectedness outcomes, potentially undermining other areas of service quality. This can include a tendency to over focus on the measured outcomes and decreasing focus on other important or related outcomes. Another potential consequence is that providers may be held accountable for outcomes that are sometimes outside of their control. Not all individuals served have access to transportation, community services, or social opportunities that directly support social connectedness, limiting the provider’s ability to influence the measured outcome. Additionally, implementing and reporting on the measure may require significant resources, especially for smaller or under-resourced providers. This may result in a reduction of resources for other performance measurement or quality improvement initiatives. To reduce the risk of these unintended consequences, the measure should be accompanied by clear guidance on appropriate use, interpretation, and its role within organization-wide and broader quality improvement strategies. It should not be used in isolation for value-based funding decisions and careful thought by users and policy makers should be put into equitable use of the measure in such initiatives. Potential unintended consequences for the beneficiary include pressure to participate in social activities that may not align with their interests or desires in an effort to demonstrate improved social connectedness outcomes. Organizations should ensure that individual choice and desire remain central when interpreting and responding to social connectedness data. If used carefully, the benefits of the RTCOM Social Connectedness measure such as improved focus on reducing isolation, increasing meaningful social connections, and enhancing service quality should outweigh the potential unintended consequences.
Comments
Staff Preliminary Assessment
CBE #5125 Staff Preliminary Assessment
Importance
Strengths
- A clear logic model is provided, depicting the relationships between inputs (e.g., funding, supportive policies, stakeholder input), activities (e.g., person-centered services, training/skill building), and desired outcomes (e.g., increased belongingness and improved relationships and reciprocity.)
- The measure is supported by a comprehensive literature review.
- The proposed measure addresses a healthcare need not sufficiently covered by existing measures, offering advantages in terms of being sufficiently sensitive to change over time that they can be used in a longitudinal manner.
- Description of patient input supports the conclusion that the measure is important to patients, family members, caregivers, and other stakeholders. This input was gained through a national content validation study of the National Quality Forum’s Home- and Community-Based Services (HCBS) Outcome Measurement Framework using a participatory planning and decision making process, Technical Expert Panels (TEPs), Advisory Committees, and vetting by representatives of provider agencies. TEPs and the RTC/OM Center Advisory Committee include people with disabilities as well as other stakeholder groups.
Limitations
- The submission notes that a problem exists regarding individuals with disabilities engaging with meaningful community-based activities at the same level of their peers without disabilities, however, it is unclear the extent of this problem based on the information provided in the submission. The submission could be strengthened by providing more information in the evidence review on how many U.S. adults have disabilities and receive HCBS services, and could be affected by this measure.
- The anticipated impact of the measure is unclear or not well supported by the evidence provided. This submission could be strengthened by including evidence that directly links to the anticipated outcomes in the logic model.
Rationale
- The new measure is rated as 'Not Met But Addressable' due to incomplete evidence and a lack of information regarding the extent of the problem. Enhancements, including more extensive evidence of significance could elevate its importance.
Closing Care Gaps
The developer did not address this optional domain.
Feasibility Assessment
Strengths
- The developer described their feasibility assessments and how those informed the final measure specifications.
- There are no fees, licensing, or other requirements to use any aspect of the measure (e.g., value/code set, risk model, programming code, algorithm).
- The developer described how all required data elements can be collected without risk to patient confidentiality.
Limitations
- Data capture does not occur during the course of care and requires additional, disruptive steps to collect, further complicating its integration into clinical workflows.
- The developer described the costs and burden associated with data collection and data entry, validation, and analysis. They are in the process of creating some mitigation processes including developing an electronic system at University of Minnesota's Institute on Community Integration that houses this initiative.
Rationale
- The measure is rated ‘Not Met’ because data capture does not appear to occur during the course of care and requires additional steps. Burden outside of cost/staffing was not described in sufficient detail.
- Submission would be strengthened with more detail on survey training, how and when the survey can be implemented (and where this is during routine care delivery), and whether there will be any implementation guidance provided. The committee should seek clarification regarding who would collect the data once the measure is implemented in HCBS agencies, when the data will be collected, and how.
Scientific Acceptability
Strengths
- None identified.
Limitations
- It was unclear whether, for each patient, the same interviewer conducted the initial and follow-up interviews used for the test-retest reliability. If not, may need to provide some explanation for why that would not bias the results. It was unclear how many patients, and from how many entities, were included in the test-retest reliability testing. The R output provided states the number of subjects as 23, which seems low. The penultimate sentence from section 5.2.2 was unclear. It stated "The sample size used was the average number of complete responses across all items."
Rationale
- The developer reported data element-level reliability based on data collected within the last five years. Report internal consistency and test-retest reliability were above the thresholds of 0.7 and 0.5, respectively. Some clarification is needed about whether the same interviewer was used for test and retest interviews for a particular patient; the number of patients included for testing; and the penultimate sentence in section 5.2.2.
Strengths
- Validity: Construct validity of measure outcomes was evaluated with parallel analysis (PA) via scree plots as well as exploratory factor analysis (EFA). Results supported the instrument's construction.
- Risk Adjustment (RA): The developer applied stratification to measure results by functional disability based on a conceptual model supported by literature and expert panels. Analysis showed a statistically significant difference in measure scores between stratification levels, therefore stratification was conducted to ensure fair comparisons and to enhance measure accuracy by accounting for differences in patient characteristics.
Limitations
- Validity: The face validity results on the accountability-entity validity, although not a factor in the rating, generally demonstrated a lack of consensus.
- RA: Additional risk variables were considered and included in conceptual model, but not analyzed due to lack of data availability.
Rationale
- Met justification (validity): The developer performed the required validity testing for this new measure, and validity testing results supported the instrument's construction. The face validity results suggest some work to be done to demonstrate accountable-entity level validity during maintenance.
- Met justification (RA): Stratification was applied to manage differences due to patient characteristics, supported by literature, TEP findings, and statistical analysis. As additional entity-level data become available, future risk analyses including other proposed risk factors are warranted to demonstrate that stratification ensures fair comparisons and enhances measure accuracy.
Use and Usability
Strengths
- The measure is not currently in use, but the developer indicates a plan for use in Quality Improvement with Benchmarking (external benchmarking to multiple organizations) and Quality Improvement (Internal to the specific organization).
Limitations
- The developer argues that accountable entities can use the measure results to improve performance. However, the guidance on implementing these actions is vague and lacks specificity.
Rationale
- For initial endorsement, there is a plan for use in at least one accountability application. However, it is unclear how accountable entities can improve their performance.
- The logic model notes key activities, such as person-centered services, training and education, and training and technical assistance. The submission could be strengthened by describing how the performance scores could be used to inform such activities and how the entities would go about securing this access to resources.
Committee Independent Review
5125 Summary
Importance
describes gap in measurement; supported by systematic review of literature, TEP; preliminary staff assessment concerns re actionable interventions may be met through additional discussion
Closing Care Gaps
Not addressed
Feasibility Assessment
See Comments on 5120
Scientific Acceptability
See comments on 5120
Agree with staff preliminary review
Use and Usability
See questions re criteria for new measure
Summary
Important new measure that addresses a gap in HCBS measure set. Additional work would be useful to specify outcomes in logic model and actionable interventions for when implemented.
Not met
Importance
Agree with staff.
Closing Care Gaps
Agree with staff.
Feasibility Assessment
In my experience, the length of these surveys often exceeds the time and focus respondents can muster.
Scientific Acceptability
Agree with staff.
Agree with staff.
Use and Usability
In my experience as VP of Quality for an agency that manages these services, while the measures are important, the only useful results for us are those that score highest and lowest. We then held focus groups of direct care staff and clients to flesh out the details of the topic. The most valuable insights from those focus groups came from issues not asked about, which, when addressed, significantly impacted the other scores.
Summary
In my experience as VP of Quality for an agency that manages these services, while the measures are important, the only useful results for us are those that score highest and lowest. We then held focus groups of direct care staff and clients to flesh out the details of the topic. The most valuable insights from those focus groups came from issues not asked about, which, when addressed, significantly impacted the other scores.
Not met but addressable
Importance
This is a new measure that seeks to quantify social connectedness for HCBS recipients. The developers presented a thorough logic model, utilized an NQF framework, sought input of various stakeholders, as well as experts in the disability measurement field. They make the case that social connectedness is important to overall HCBS outcomes for individuals with disabilities; the literature review is comprehensive
Closing Care Gaps
Not adressed
Feasibility Assessment
The developers state that administering the measure as an interview requires approximately 10 minutes per beneficiary; this may be difficult in a clinical setting. In addition, the responses need to be manually entered after the interview into a secure data system, which adds another burden to clinical staff.
Scientific Acceptability
Internal consistency reliability (.84) and test-retest reliability (.93) are very good
Agree with staff assessment
Use and Usability
The developers state that currently there is a gap in measures available to provide reliable and valid data to providers about HCBS outcomes, such as social connectedness. This measure could help providers fill that gap and allow them to report progress to CMS. While the results will provide a metric around social connectedness, it is not clear how providers can use these data to manage/impact care.
Summary
Another important and meaningful measure from this team of developers.
5125
Importance
This is not a PRE-PM. The developer states explicitly in 2.3 that "The intent behind the Social Connectedness measure is to impact the outcomes of Social Support (different types of support people receive from their social network)." Close examination of the instrument items informing the measure suggests this is an outcome measure,
Closing Care Gaps
not submitted, optional
Feasibility Assessment
Agree with staff assessment. In additiona, it eens optimistic that the 14 item survey can be conducted in a 10 minute encounter, especially given the content of the items.
Scientific Acceptability
agree with staff assessment.
Disagree with staff assessment as the instrument items informing the measure seem to relate to outcomes rather than experience of care/service.
Use and Usability
Agree with staff assessment but have other concerns, mainly that the items in the instrument appear to relate to outcomes of service, not experience of service.Not clearhow service providers could use this measure to inform quality improvement efforts focused on experience of care.
Summary
This is not a PRE-PM. The developer states explicitly in 2.3 that "The intent behind the Social Connectedness measure is to impact the outcomes of Social Support (different types of support people receive from their social network)." Close examination of the instrument items informing the measure suggests this is an outcome measure,
Public Comments
No public comments submitted…
No public comments submitted for this measure.