Adult Blood Culture Contamination Rate; A national measure and standard for clinical laboratories and antibiotic stewardship programs
Description
Goal:
CBE ID
3658

Goal:
This process measure seeks to capture follow up after asthma-related emergency department (ED) visits for children with asthma after discharge from the ED, as recommended by the NHLBI 2007 guidelines. This measure assesses the percentage of asthma-related ED visits for children ages 3-21 with a follow-up visit with a primary care clinician or an asthma subspecialist within 14 days of discharge from the ED, within the reporting year, for patients who are enrolled in the health plan for two consecutive months following the ED visit.
This is a process measure of the annual proportion of eligible patients ≥ 18 years of age, who were prescribed aspirin, P2Y12 inhibitor, and statin at discharge following PCI with or without stenting.
This measure estimates hospital risk standardized odds ratio for death from all causes within 30 days following transcatheter aortic valve replacement. The measure uses clinical data available in the STS/ACC TVT Registry for risk adjustment. For the purpose of development and testing, the measure used site-reported 30-day follow-up data contained in the STS/ACC TVT Registry.
This measure estimates hospital risk-standardized 30-day all-cause mortality rate following percutaneous coronary intervention (PCI) among patients who are 18 years of age or older without STEMI and without cardiogenic shock at the time of procedure. The measure uses clinical data available in the National Cardiovascular Data Registry (NCDR) CathPCI Registry for risk adjustment. For the purpose of development and testing, the measure used a Medicare fee-for-service (FFS) population of patients 65 years of age or older with a PCI.
Annual risk-adjusted standardized infection ratio (SIR) of observed over predicted deep incisional primary and organ/space surgical site infections (SSIs), over a 30-day post-operative surveillance period, among hospitalized adults who are >=18 year of age with a date of admission and date of discharge that are different calendar days, and the patient underwent a colon surgery (COLO) or abdominal hysterectomy (HYST) at an acute care hospital or oncology hospital. The 30-day postoperative surveillance period includes SSIs detected upon admission to the facility or a readmission to the same facility or a different facility (other than where the procedure was performed) and via post-discharge surveillance.
Number of annually observed hospitalized patients who are >=18 years of age with a date of admission and date of discharge that are different calendar days, and the patient underwent a colon surgery (COLO) or abdominal hysterectomy (HYST) and developed a deep incisional primary or organ/space surgical site infection (SSI) within the 30-day postoperative surveillance period. The 30-day postoperative surveillance period includes SSIs detected upon admission to the facility or a readmission to the same facility or a different facility (other than where the procedure was performed) and via post-discharge surveillance.
N/A
N/A
Number of annually predicted hospitalized patients who are >=18 years of age with a date of admission and date of discharge are different calendar days, and the patient underwent a colon surgery (COLO) or abdominal hysterectomy (HYST) and developed a deep incisional primary or organ/space surgical site infection (SSI) within the 30-day post-operative surveillance period. The 30-day postoperative surveillance period includes SSIs detected upon admission to the facility or a readmission to the same facility or a different facility (other than where the procedure was performed) and via post-discharge surveillance.
N/A
Endorsement History: Endorsed with conditions in 2012 and endorsement retained during maintenance review in 2025.
Link to Endorsement Measure Record: 30-Day Post-Operative Colon Surgery (COLO) and Abdominal Hysterectomy (HYST) Surgical Site Infection (SSI) Standardized Infection Ratio (SIR)
Impact Summary: This measure supports the PCHQR Program’s objectives by providing transparent, standardized infection ratio data that empowers consumers to make informed health care decisions and motivates hospitals and clinicians to focus on quality improvement and adherence to best practices in inpatient care for Medicare beneficiaries.
Analysis of measure performance over the past 4 years is impacted by the small number of PCHQR hospitals available to report on this measure, rather than low participation among a large eligible group.
With only seven entities per year in Figure 1a and eight in Figure 1b, distinguishing true trends from random variation is difficult, and little discernable change is observed across the 4 years. Tables 1a and 1b demonstrate potential improvements that translate to a reduction in surgical site infections of fewer than three eligible patients per entity.
For this measure, Battelle reviewed the following publicly available datasets available at Hospitals data archive | Provider Data Catalog:
Battelle analyzed all values for “PCH_6” and “PCH_7” not marked as “Not Available” from the corresponding PCH_HEALTHCARE_ASSOCIATED_INFECTIONS_HOSPITAL.csv file.
About Figure 1a and 1b: Figures 1a and 1b are boxplots that show how scores have changed based on the most recent 4 years of data available. For each year, the boxplot displays a box with lines and dots to help visualize the range and distribution of scores. The dots represent the points where the lowest 5% and highest 5% of scores fall, and the line connecting them shows where 90% of the scores are located. The box itself covers the middle half of the scores, from the 25th to the 75th percentile. Inside the box, a horizontal line marks the median score, which is the middle value, while a “+” sign shows the average score. This type of graph makes overall trends in scores over time as well as the consistency and spread of the results easier to understand.
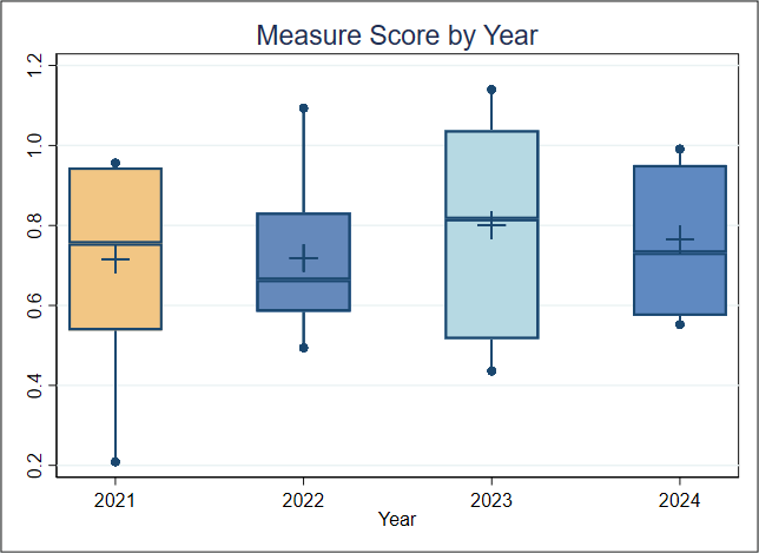
Figure 1a. Boxplot of Measure Score by Year (Colon Surgery)
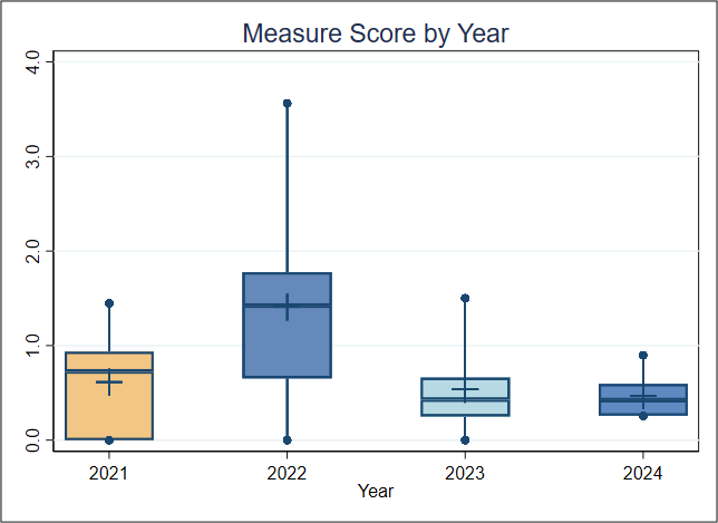
Figure 1b. Boxplot of Measure Score by Year (Abdominal Hysterectomy)
Figure 1a and 1b Interpretation: In Figure 1a, each year includes data from only seven entities, while Figure 1b includes eight entities per year. Because of this small sample size, any trends observed over the 4 years could be due to random variation rather than meaningful change. Overall, the limited number of PPS-exempt cancer hospitals participating and reporting in this program makes analyzing overall performance trends difficult. For this measure, lower scores reflect higher quality of care.
About Table 1a and 1b: Tables 1a and 1b illustrate the distribution of scores (SIRs), raw rates, and the number of patients represented within each entity. It is important to note that the entities with the lowest or highest scores may contain more or fewer patients than other entities. For example, if the lowest-scoring entity includes only 5% of the total patient population, then smaller entity size may be associated with lower performance scores.
Table 1a. Importance (Entity by Measure Score, FY2024) Colon Surgery in the Most Recent Year of Data Available
| Overall | Entity 1 | Entity 2 | Entity 3 | Entity 4 | Entity 5 | Entity 6 | Entity 7 | |
| Average SIR (Standard Deviation) | 0.764 (0.184) | 0.574 | 0.552 | 0.644 | 0.732 | 0.907 | 0.951 | 0.991 |
| Average Raw Rate (Standard Deviation) | 3.55 (0.82) | 2.68 | 2.68 | 3.08 | 3.21 | 4.22 | 4.47 | 4.50 |
| Entities | 7 | 1 | 1 | 1 | 1 | 1 | 1 | 1 |
| Patients | 3,840 | 486 | 784 | 455 | 467 | 284 | 1,164 | 200 |
Table 1b. Importance (Entity by Measure Score, FY2024) Abdominal Hysterectomy in the Most Recent Year of Data Available
| Overall | Entity 1 | Entity 2 | Entity 3 | Entity 4 | Entity 5 | Entity 6 | Entity 7 | Entity 8 | |
| Average SIR (Standard Deviation) | 0.471 (0.231) | N/A | 0.257 | 0.260 | 0.318 | 0.423 | 0.593 | 0.547 | 0.898 |
| Average Raw Rate (Standard Deviation) | 0.599 (0.388) | 0 | 0.376 | 0.388 | 0.446 | 0.631 | 0.826 | 0.840 | 1.283 |
| Entities | 8 | 1 | 1 | 1 | 1 | 1 | 1 | 1 | 1 |
| Patients | 2,561 | 3 | 266 | 258 | 224 | 317 | 242 | 238 | 1,013 |
Table 1a and Table 1b Interpretation: Note that there are data for only seven entities for Table 1a and eight entities for Table 1b. To estimate the number of negative outcomes (surgical site infections), the number of patients is multiplied by the average raw rate for each entity.
The total estimated number of negative outcomes across all entities for Table 1a is about 140. If the average performance of the lowest two entities (2.68%) is considered a plausible, achievable rate, and the other five entities improved to reach that rate, about 30 fewer colon surgery patients would experience surgical site infections. This translates to about four patients per entity and could mean that improving performance on this measure could help ensure that fewer colon surgery patients would contract surgical site infections, potentially leading to better health outcomes.
The total estimated number of negative outcomes (surgical site infections) across all entities for Table 1b is about 22. If all entities reduced the rate to 0%, 22 fewer abdominal hysterectomy patients would experience surgical site infections. This translates to less than three eligible patients per entity.
The Meaningfulness criterion will be evaluated as part of the full Preliminary Assessment available in September.
This criterion will be evaluated as part of the full Preliminary Assessment available in September.
This criterion will be evaluated as part of the full Preliminary Assessment available in September.
The TAVR 30-day morbidity/mortality composite is a hierarchical, multiple outcome risk model that estimates risk standardized results (reported as a “site difference”) for the purpose of benchmarking site performance. This measure estimates hospital risk standardized site difference for 5 endpoints (death from all causes, stroke, major or life-threatening bleeding, acute kidney injury, moderate or severe paravalvular aortic regurgitation) within 30 days following transcatheter aortic valve replacement.
Percentage of individuals at least 18 years of age as of the beginning of the performance period with schizophrenia or schizoaffective disorder who had at least two prescriptions filled for any antipsychotic medication and who had a Proportion of Days Covered (PDC) of at least 0.8 for antipsychotic medications during the performance period.
Percentage of patients, age = 18 and < 80 at diagnosis, who have their first diagnosis of cancer (epithelial malignancy) that is lymph node positive and at AJCC stage III, whose primary tumor is of the colon and chemotherapy was recommended or administered within 4 months (120 days) of diagnosis
Percentage of female patients, age = 18 at diagnosis, who have their first diagnosis of cancer (epithelial malignancy), at AJCC T1cN0M0 or stage IB to IIIC, whose primary tumor is of the breast, and is progesterone or estrogen receptor positive with adjuvant hormonal therapy (recommended or administered) within 1 year (365 days) of diagnosis